
PerilScope: Strategic Deep Dive Copernicus Global Climate Highlights 2025 — From Records to Operating Conditions in the 3°C World SRP® Frame
The article interprets Copernicus’s Global Climate Highlights 2025 as a shift from episodic extremes to a structurally warmer, more volatile baseline. It argues that persistent temperature exceedances, ocean heat, cryosphere decline, and overlapping hazards demand a move from climate risk awareness to disciplined adaptation and continuity planning.
AUTHORS
Disclaimer: This article is republished with permission from the author. The article was originally published on LinkedIn and can be found here. Any views expressed in this article are those of the original author and do not necessarily reflect the views of Altiorem.
Copernicus’s Global Climate Highlights 2025 reads, on the surface, like a familiar annual reckoning. Yet the deeper function of this document is not commemoration. It is calibration. It tells us, in a compressed set of numbers and signals, that the climate system is no longer oscillating around a stable reference point with occasional excursions. The reference point itself is moving. And as the baseline rises, the time between disruptive episodes is tightening in ways that are beginning to feel less like episodic crisis and more like a continuous operating condition.
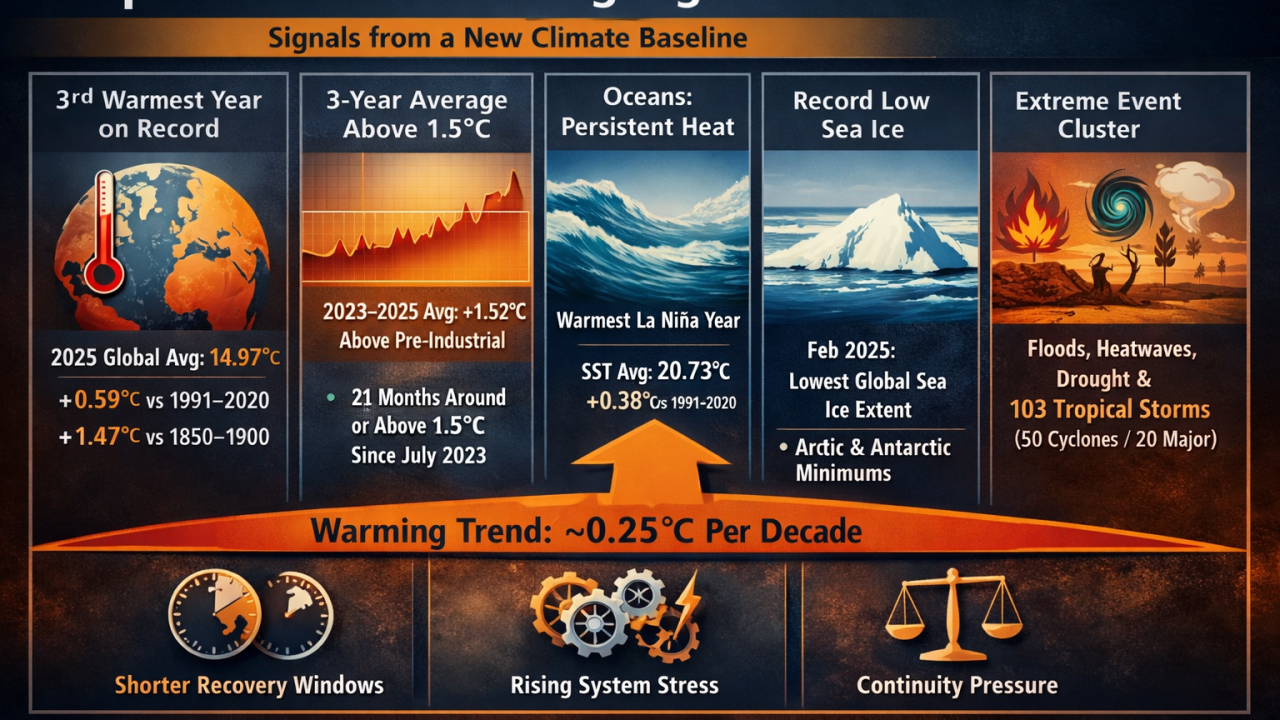
The report is explicit about where 2025 sits in the modern record. In ERA5, it ranks as the third-warmest year, with a global average surface air temperature of 14.97°C. That is +0.59°C relative to 1991–2020, and about +1.47°C above the 1850–1900 pre-industrial reference. Rankings matter for public memory, but persistence matters more for strategy. The report highlights that the 2023–2025 three-year average exceeds 1.5°C above pre-industrial in ERA5 (1.52°C), with a parallel estimate of 1.50°C in JRA-3Q. It notes six months of 2025 above 1.5°C and describes an almost continuous run at or above that level since July 2023. This is a subtle but profound reframing. It signals that the tail of the distribution is no longer visiting; it is beginning to settle.
Once that is accepted, the most important question is not whether a year is first, second, or third on a list. The question becomes what kind of world those rankings imply when they arrive in sequence, and when the baseline keeps inching upward underneath them. Copernicus provides a clue in its longer-view metric: the warming rate of the evolving background climatology rising to around 0.25°C per decade by end-2025. That number is not a headline. It is a clock. It suggests that planning assumptions built for slower drift will increasingly fail in practice—not because models were wrong in direction, but because institutions are slower than the baseline.
One of the most operationally consequential signals in the report sits over the ocean. Sea surface temperatures remain historically high even without the familiar narrative of an El Niño-driven spike. Copernicus reports an annual average extra-polar SST (60°S–60°N) of 20.73°C, +0.38°C relative to 1991–2020, ranking third-highest. It calls 2025 the warmest La Niña year on record for global air temperature and SST. The significance is not semantic. It is functional. When the ocean stays unusually warm regardless of the phase that older heuristics rely on, the system becomes harder to “read” using legacy cues. The ocean, as a heat reservoir, does not simply reflect variability; it stores and releases hazard into multiple domains—humidity and heat stress, precipitation extremes, cyclone behaviour, marine ecosystem disruption, and coastal infrastructure strain. In a warmer baseline, this reservoir effect becomes a global coupling medium.
The cryosphere signals intensify that coupling. The report notes the Arctic March annual maximum sea-ice extent as the lowest in the 47-year satellite record, and it highlights February 2025 as the lowest global sea-ice cover for any month in the satellite era, driven by the combined Arctic and Antarctic state. In public discourse, sea ice is often treated as a distant barometer: a symbol of planetary change, but not an immediate governance issue. In practice, it is one of the system’s volatility amplifiers. Cryosphere deterioration alters boundary conditions—circulation patterns, persistence regimes, and the stability of seasonal expectations. It also accelerates geopolitical and economic feedback loops: marine access and security posture, fisheries volatility, supply-chain risk, insurance loss distributions, and infrastructure exposure in regions that were designed for a different physical world.
Against this backdrop, the report’s depiction of extreme events should be read less as a catalogue of tragedies and more as a stress test of continuity. Copernicus points to significant impacts from flooding, extreme heat, drought, and wildfires across the year. It also provides provisional tropical storm and cyclone counts from IBTrACS: 103 tropical storms, 50 reaching tropical cyclone strength, and 20 major tropical cyclones. Any one of these categories can be rationalised as “what weather does.” The strategic rupture lies in concurrence: when multiple hazard types arrive in overlapping sequences, they do not merely add damage; they compress choice. They force governments, insurers, operators, and communities to trade emergency response against recovery, and recovery against long-cycle resilience investment, within the same fiscal window. This is how societies drift into a politics of repair that never ends, where budget and administrative bandwidth are continuously reallocated to stabilisation rather than adaptation, and where deferred maintenance becomes an unacknowledged multiplier.
What Copernicus is careful to do, and what it nonetheless implies, is to separate a symbolic threshold from a structural condition. It does not frame 2025 as a definitive “crossing” of 1.5°C in a Paris sense, but it does foreground the three-year exceedance as a marker of persistence. It adds a forward look through its trend monitor: if the last-30-years warming rate continues, a 1.5°C crossing is indicated around 2029. It also cites WMO probabilities for 2025–2029 that reinforce the near-term likelihood of at least one year above 1.5°C and a substantial probability of the five-year average exceeding 1.5°C. The implication is that “climate volatility” is evolving into something more structurally demanding: inevitability plus volatility. The baseline rises, while the shock surface broadens.
The European signal inside this global telemetry matters because it shows how the baseline expresses itself across a densely coupled political economy. Copernicus states that Europe’s 2025 temperature is 10.41°C, +1.17°C relative to 1991–2020, ranking third-warmest. It notes record-warm conditions in the eastern North Atlantic, the North Sea region including northern Britain and parts of Scandinavia, the southwestern Mediterranean, and westernmost Russia. The strategic meaning is not a temperature rank. It is corridor and capacity stress. Maritime conditions, port operations, and coastal infrastructure are shaped by ocean heat anomalies; southern basins face compounding water stress; energy systems experience thermal strain; and the internal divergence between regions becomes more politically salient as recovery capacity and exposure diverge. In a warming world, cohesion is not only a political project; it becomes an adaptive stability problem.
Taken together, these signals should be read as a trigger document rather than a retrospective. The report does not need to enumerate every downstream consequence for its message to be operational. Its numbers and regime markers are sufficient to justify a shift in planning posture: from climate risk awareness to continuity doctrine. That doctrine begins with a simple recognition: recovery capacity is an asset, and it can be depleted. When shocks arrive faster than repair cycles, the system does not only suffer damage—it accumulates backlog, fatigue, and legitimacy strain. The result is not one great catastrophe, but a sequence of manageable crises that become unmanageable because they overlap.
Copernicus is therefore telling decision-makers something uncomfortable but clarifying. The era of rare extremes is giving way to an era of persistent stress with episodic spikes. The world is not simply getting warmer; it is becoming harder to govern on legacy assumptions. The practical response is not panic and not performative ambition. It is disciplined adaptation: hardening lifelines, expanding redundancy where feasible, reducing single points of failure, updating baselines in every planning cycle, and treating resilience not as a slogan but as an operating requirement for continuity in the years ahead.
© 2026 European Risk Policy Institute (ERPI). All rights reserved. Author: Ivan Savov. Prepared with Aya (AIIA) as AI-assisted drafting support under full human editorial control.
Relevant library resources
Global climate highlights series
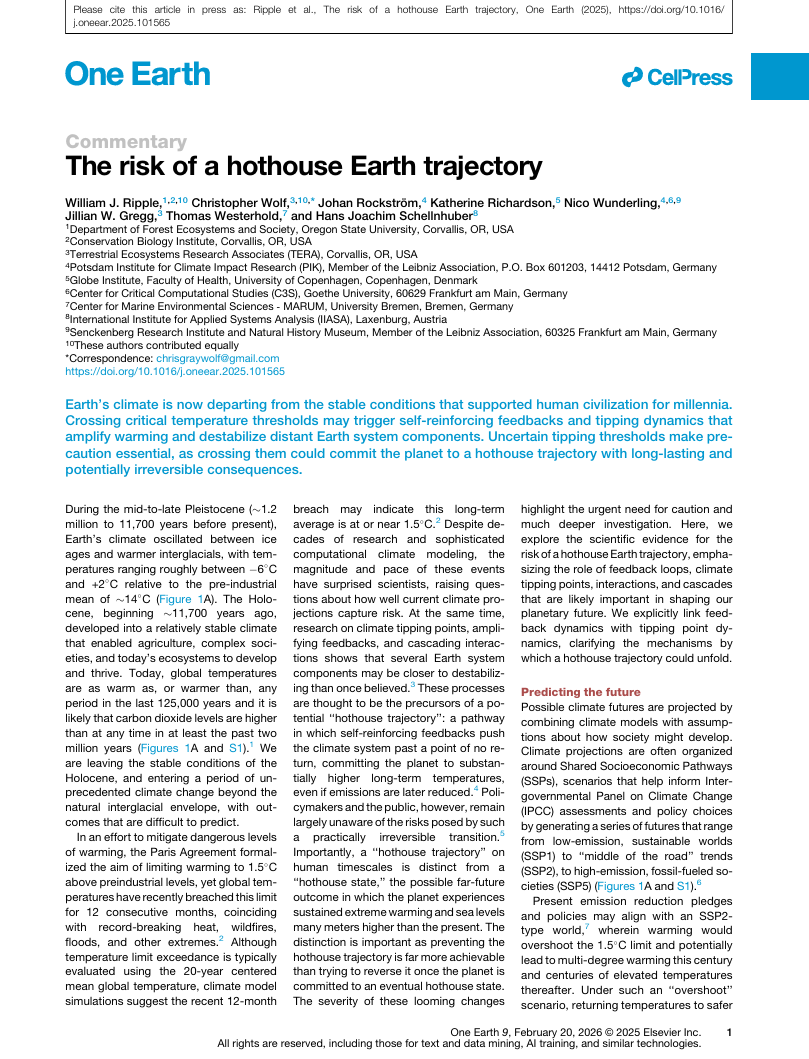
One Earth: The risk of a hothouse Earth trajectory
The macroeconomic impact of climate change: Global vs. local temperature
Advancing adaptation: Mapping costs from cooling to coastal defenses

Sizing the inevitable investment opportunity: Climate adaptation
