Library | Finance relevance
Insurance and risk professionals
Refine
346 results
REFINE
SHOW: 16

Water footprint network
Water Footprint Network is a non-profit, global collaboration platform advancing fair and smart freshwater use. It champions science-based water footprint assessment, offers open-access tools and data for businesses, governments and communities, and guides sustainable, equitable water governance to address water scarcity and pollution worldwide.
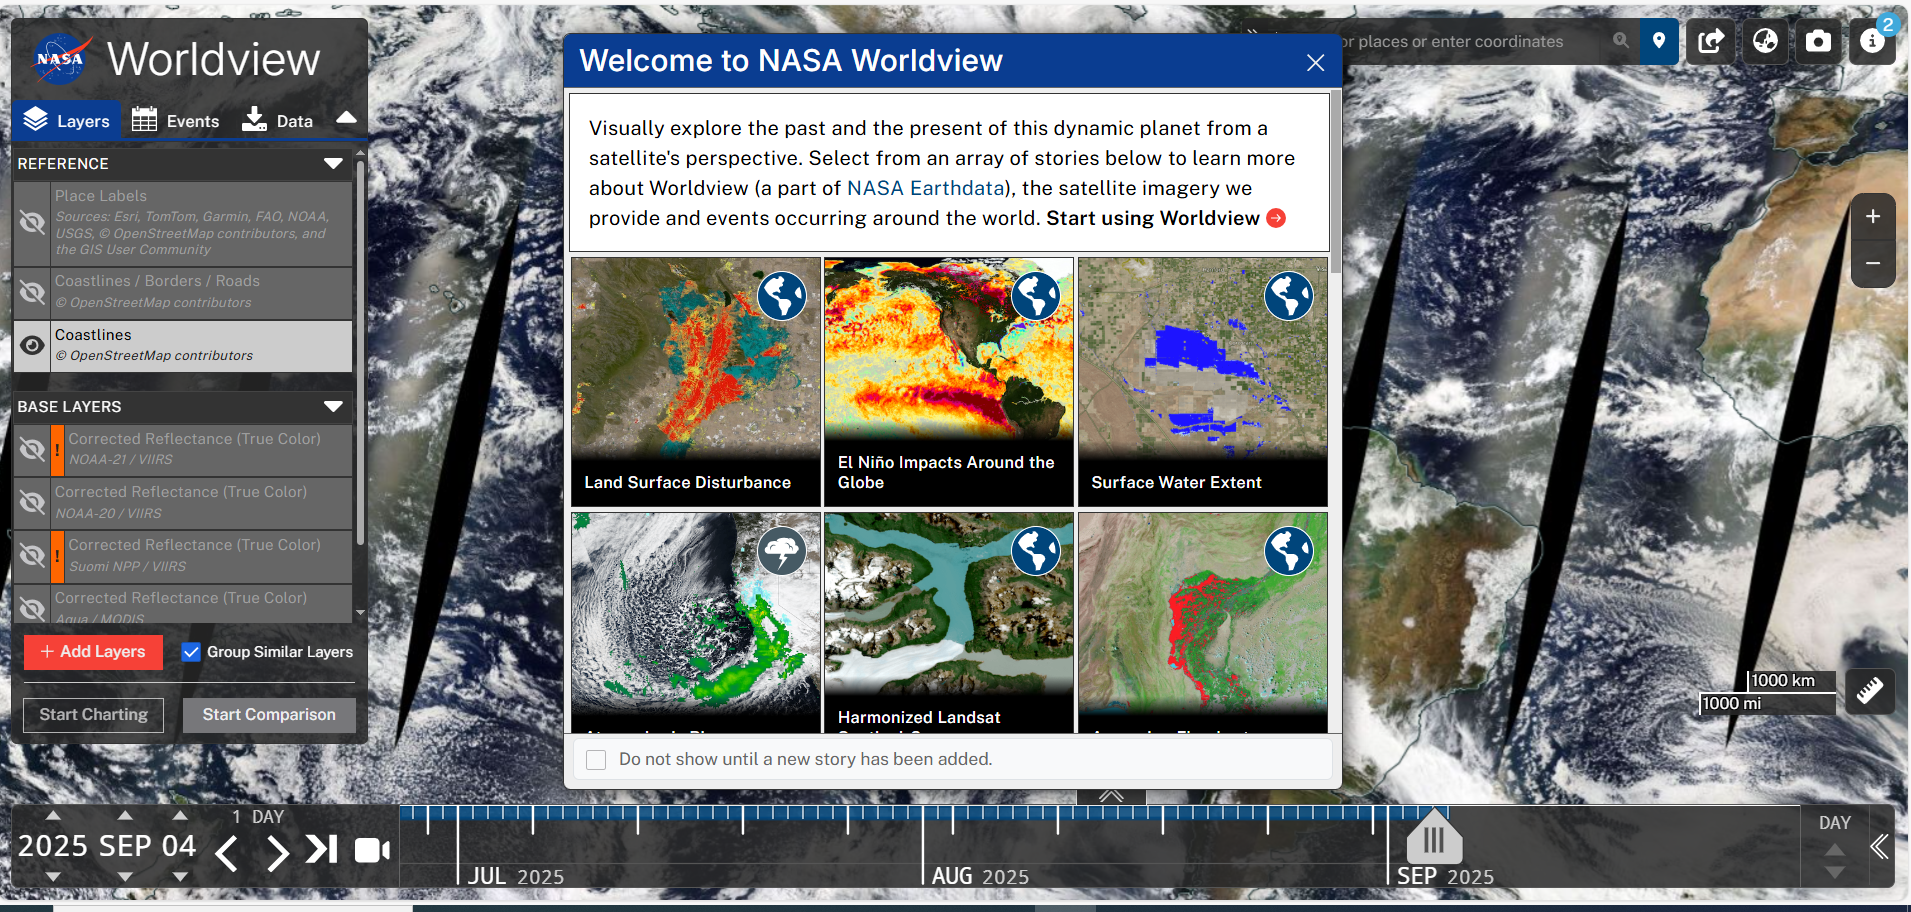
NASA world viewer
NASA’s Worldview is a web‑based visualisation tool offering interactive browsing, animation and download of over 1000 global satellite imagery layers, many available within three hours of observation. It supports time‑critical and historical analysis of natural hazards, climate phenomena and environmental change.
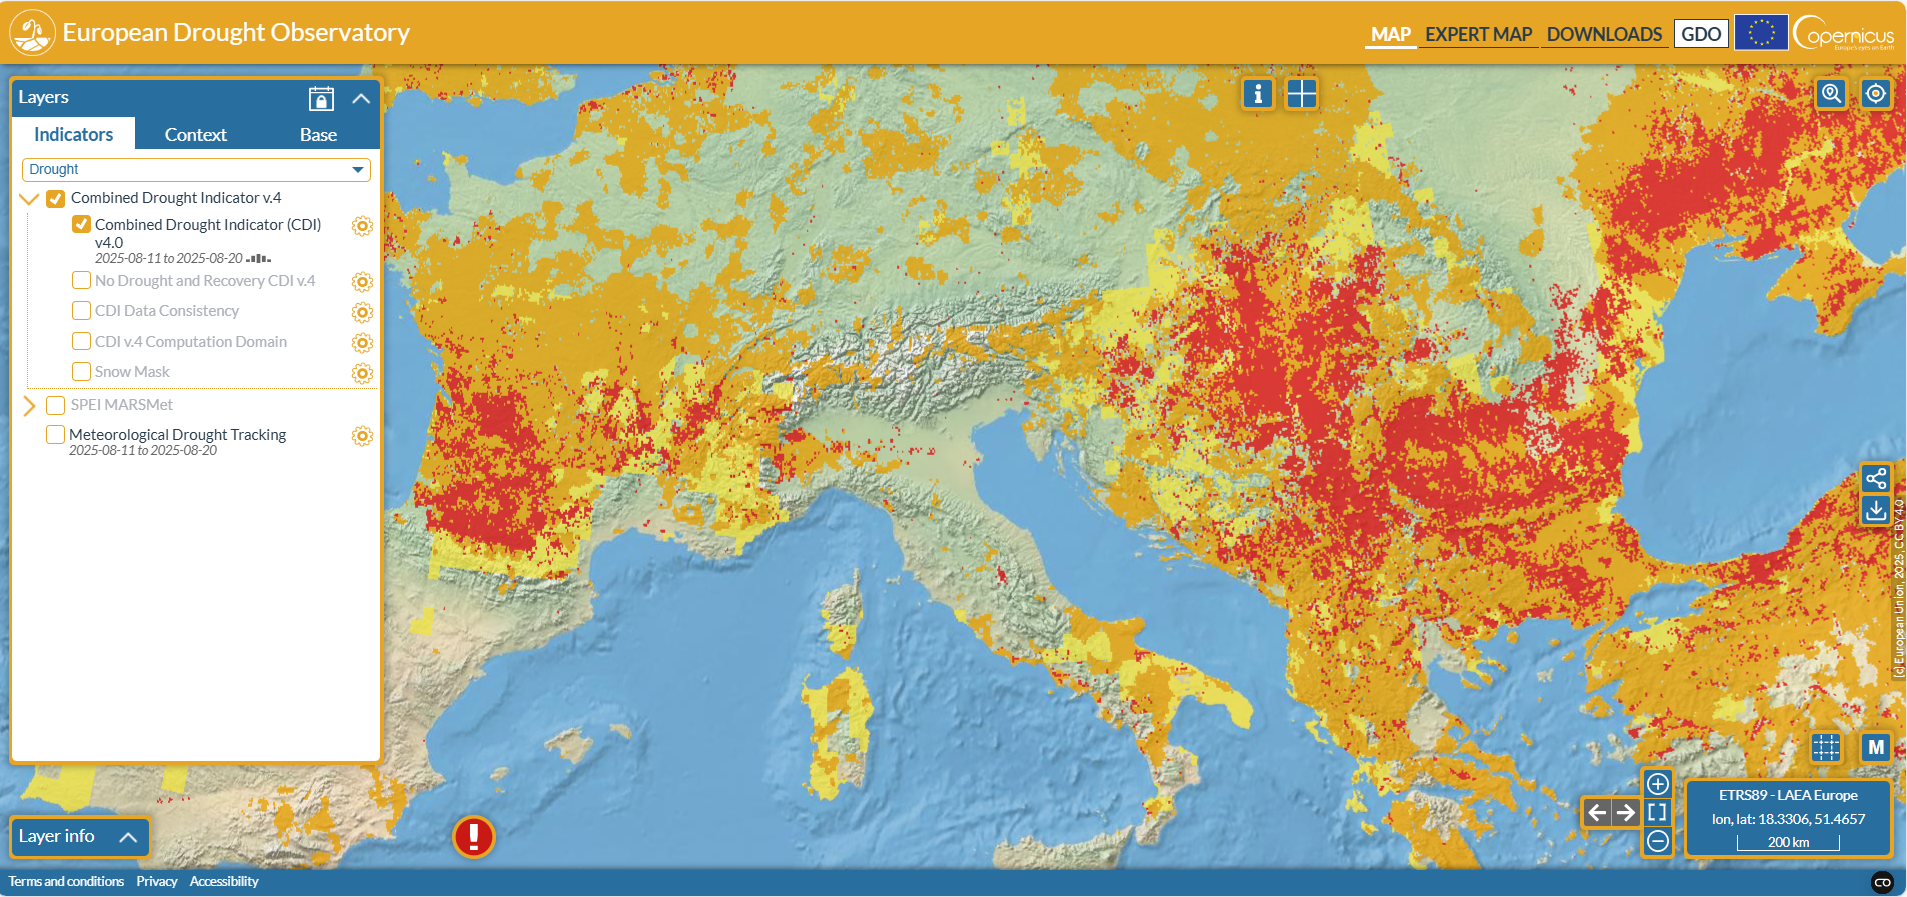
European drought observatory
Copernicus’ European Drought Observatory (EDO) mapviewer displays up‑to‑date drought indicators—such as soil moisture, low‑flow, precipitation and the Combined Drought Indicator—across Europe. Users can access, view and download data freely, though caution is advised interpreting some hydrological outputs east of Poland since mid‑May 2025.
Joint Research Centre
Joint Research Centre (JRC) is the European Commission’s science and knowledge service. It provides independent research and data to support EU policies on climate change, energy, health, food security, digital innovation and safety. JRC delivers scientific evidence to help policymakers address global challenges with reliable analysis and solutions.
Resilient Planet Data Hub
Resilient Planet Data Hub offers open, globally consistent climate and nature risk data to guide resilience and adaptation investment. Convened by UNDRR, Insurance Development Forum and University of Oxford, it powers tools like the GRI Risk Viewer and Resilient Planet Finance Lab to mobilise action, policy and finance for people, planet and prosperity.

Climate Service Center Germany (GERICS)
Climate Service Center Germany (GERICS) is a Hamburg-based research institute established in 2009 under Germany’s high-tech strategy. As part of Helmholtz-Zentrum Hereon, GERICS employs an interdisciplinary team of over 80 scientists. It develops prototype climate-service products—such as fact-sheets, city series and signal maps—to support decision-makers adapting to climate change.

Climate impacts online (KlimafolgenOnline)
A free, interactive web tool developed by the Potsdam Institute for Climate Impact Research, KlimafolgenOnline provides country‑ and region‑level projections—using historical observations and future scenarios—for multiple sectors, including agriculture, forestry, biodiversity, tourism and health. It enables visualisation of climate impacts via maps and charts.

Copernicus interactive climate atlas (C3S atlas)
The Copernicus Interactive Climate Atlas (C3S Atlas) is a web‑based tool from the Copernicus Climate Change Service offering flexible exploration of past, present and future climate data. It integrates observational, reanalysis and projection datasets, and allows users to customise regional analyses and visualise key climate variables via maps, charts and time series.

Predictia Intelligent Data Solutions
Predictia delivers AI‑powered custom software for climate, weather and health data. Founded in 2008 as a spin‑off from the University of Cantabria, it specialises in data management, modelling and visualisation across sectors such as Earth sciences, remote sensing and industry 4.0, supporting informed decision‑making for adaptation and mitigation.

Copernicus Climate Change Service (C3S)
Copernicus Climate Change Service (C3S) delivers authoritative, free-to-access climate data, tools and projections. It supports EU adaptation and mitigation policy by providing accurate information on past, present and future climate. Serving scientists, policymakers, media and public, C3S enables informed climate action via trusted Earth-observation insights.

Climate impact explorer
The Climate Impact Explorer is a web‑based visualisation tool by Climate Analytics that presents maps and graphs of projected climate‑change impacts such as temperature, precipitation and economic damages across global regions and provinces under different warming levels (e.g. 1.5 °C, 2 °C) and emission scenarios.

Sizing the inevitable investment opportunity: Climate adaptation
This report estimates the climate adaptation market will grow from US\$1tn in 2024 to US\$4tn by 2050, with US\$2tn driven by global warming. Investment opportunities could reach US\$9tn, spanning emerging and established solutions, largely resilient to climate scenario differences over the next 25 years.

Local sea-level projections
This tool shows local sea-level projections (relative to 2000) using tide-gauge and gridded data from Kopp et al (2014), extended by Rasmussen et al (2018) and Bamber et al (2019). It provides scenarios labelled RCP26, RCP45 and RCP85, with uncertainty ranges and attention to regional differences.

GRI risk viewer
The Global Resilience Index (GRI) Risk Viewer provides global‑scale risk metrics across hazard, exposure and vulnerability to assess risks to people, planet and prosperity via open, publicly available datasets.
GHG protocol agricultural guidance: Interpreting the corporate accounting and reporting standard for the agricultural sector
The GHG protocol agricultural guidance provides a framework for agricultural companies to develop greenhouse gas (GHG) inventories aligned with the Corporate Standard. It offers sector-specific methodologies to account for direct and indirect emissions, carbon stock changes, and unique agricultural factors such as land use change and biological processes. The guidance enhances consistency, transparency, and usability of agricultural GHG data for decision-making and reporting.

The greenhouse gas protocol: A corporate accounting and reporting standard
The Greenhouse Gas Protocol Corporate Standard provides a framework for businesses to quantify and report greenhouse gas emissions. It establishes standardised accounting principles, categorises emissions by scope, and offers guidance for setting organisational and operational boundaries. The Standard promotes transparency, consistency, and comparability in corporate GHG inventories.