Library | Resource Types
Online tool/database
Tools and databases are resources designed to help members evaluate the sustainability impact and financial performance of investments or business decisions. Tools allow members to assess impact, model scenarios and enable informed decisions that align with sustainability goals.
Refine
230 results
REFINE
SHOW: 16

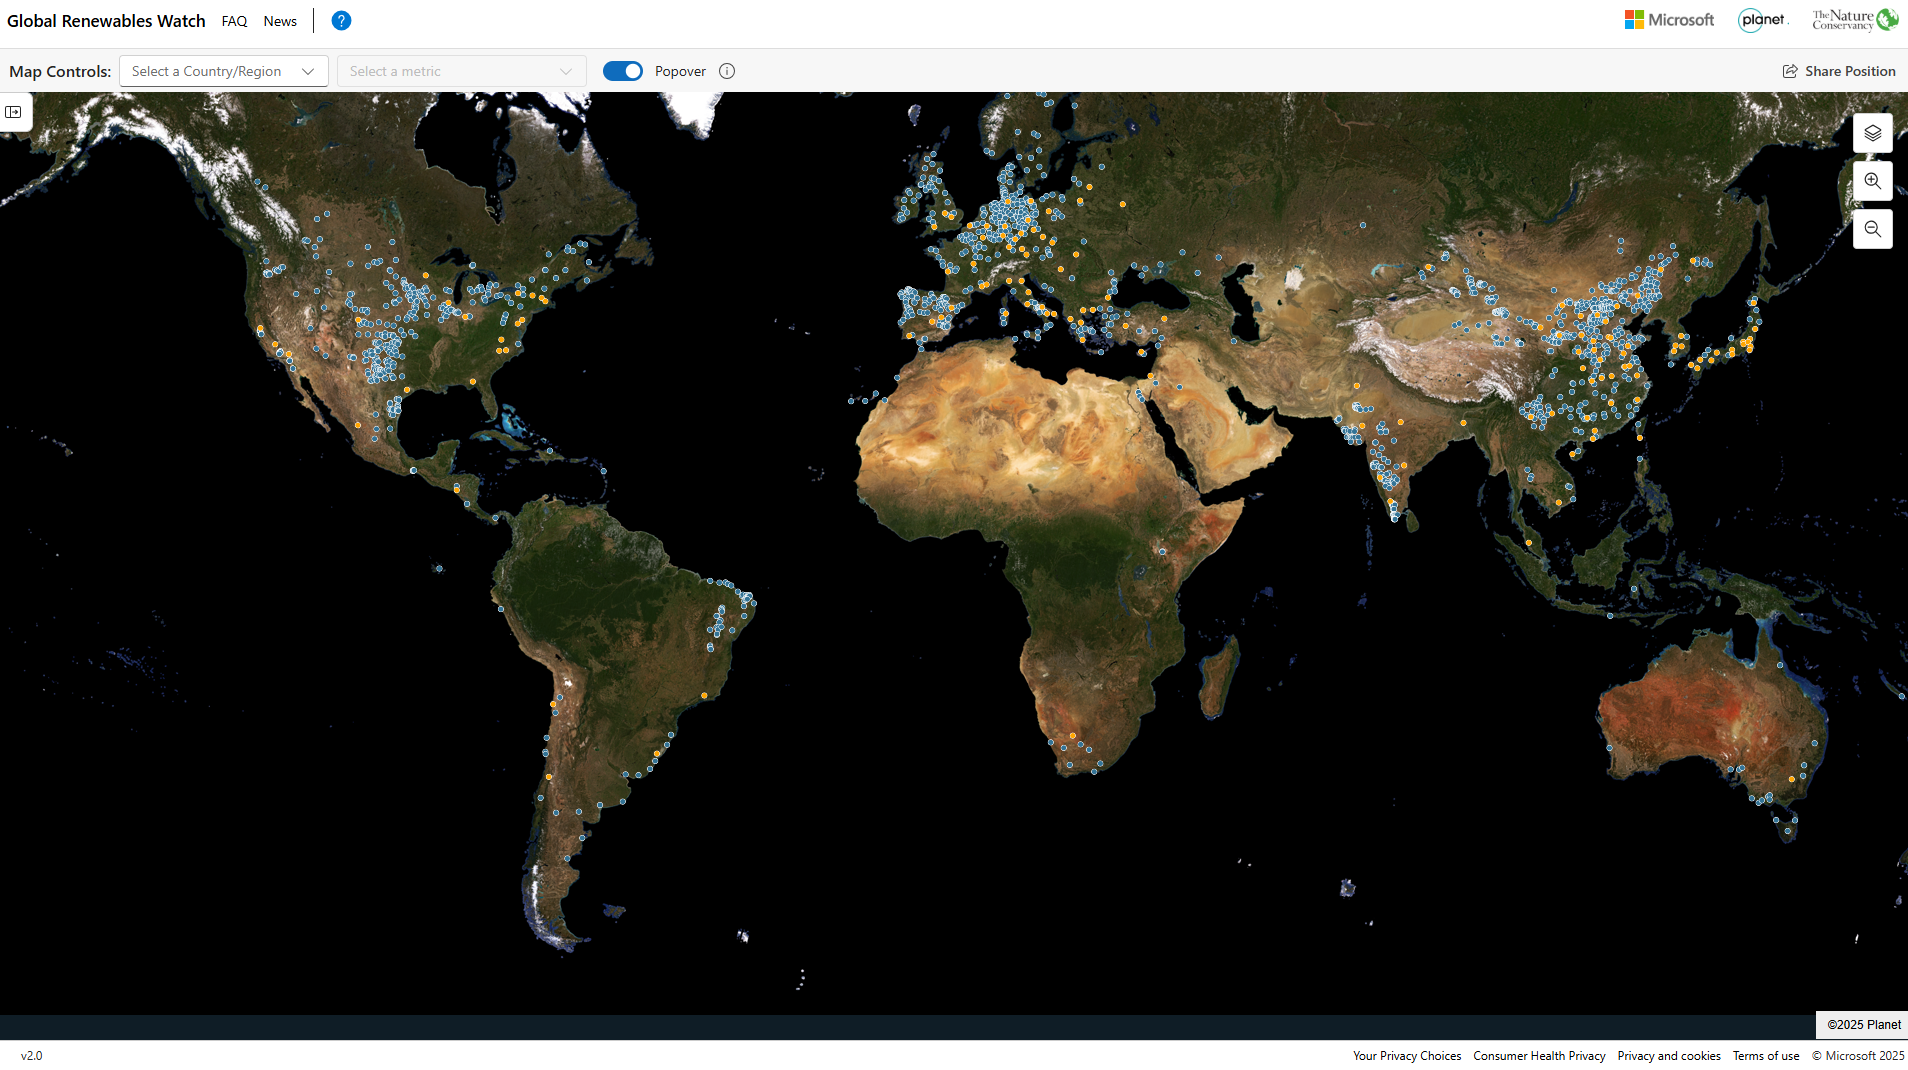
Global Renewables Watch
Global Renewables Watch Atlas is an interactive platform mapping utility-scale solar and wind installations worldwide using AI and satellite imagery. It provides regularly updated geospatial data to track deployment trends, estimate capacity, and assess progress in the energy transition, supporting analysis by policymakers, researchers, and finance professionals.
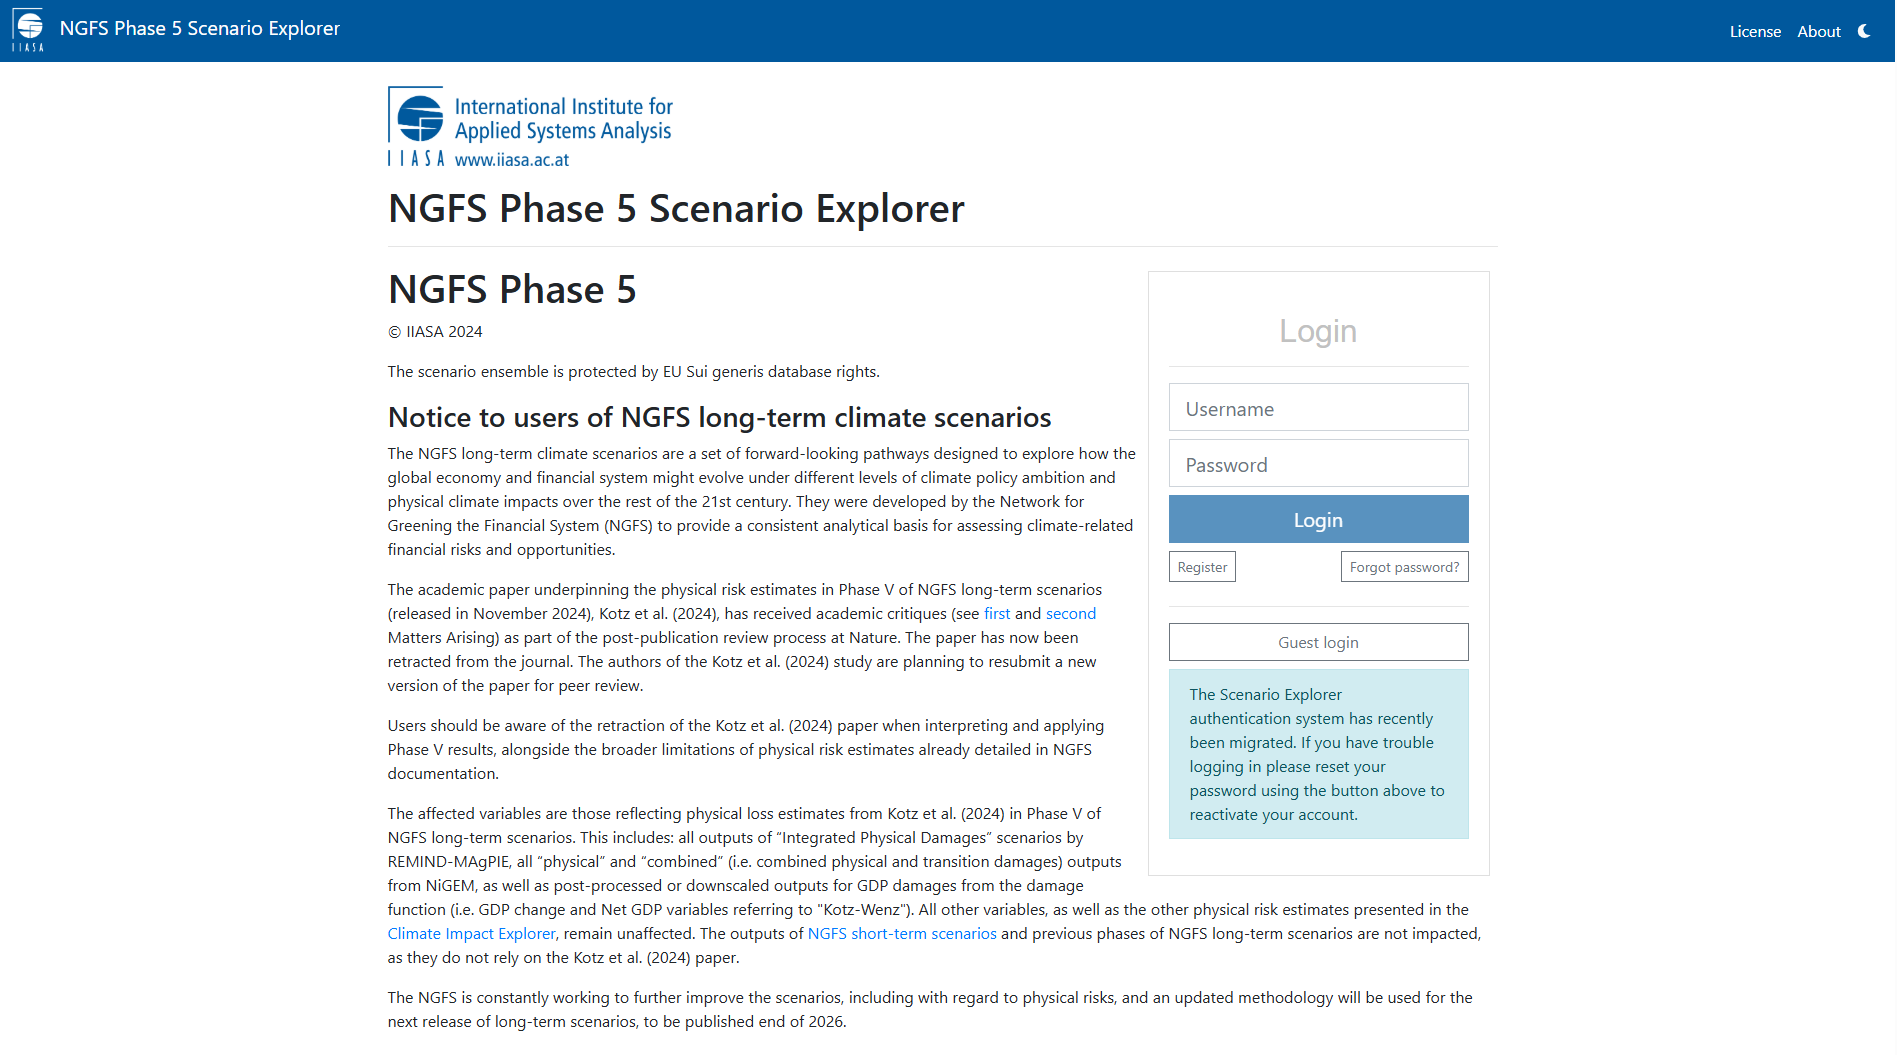
NGFS Phase 5 Scenario Explorer
Web-based platform by NGFS and IIASA providing access to climate scenario data. It enables users to visualise, compare and download time-series data on transition pathways, physical risks and macroeconomic impacts, supporting climate risk analysis, stress testing and financial modelling. Data can be accessed via workspaces, bulk downloads or APIs.
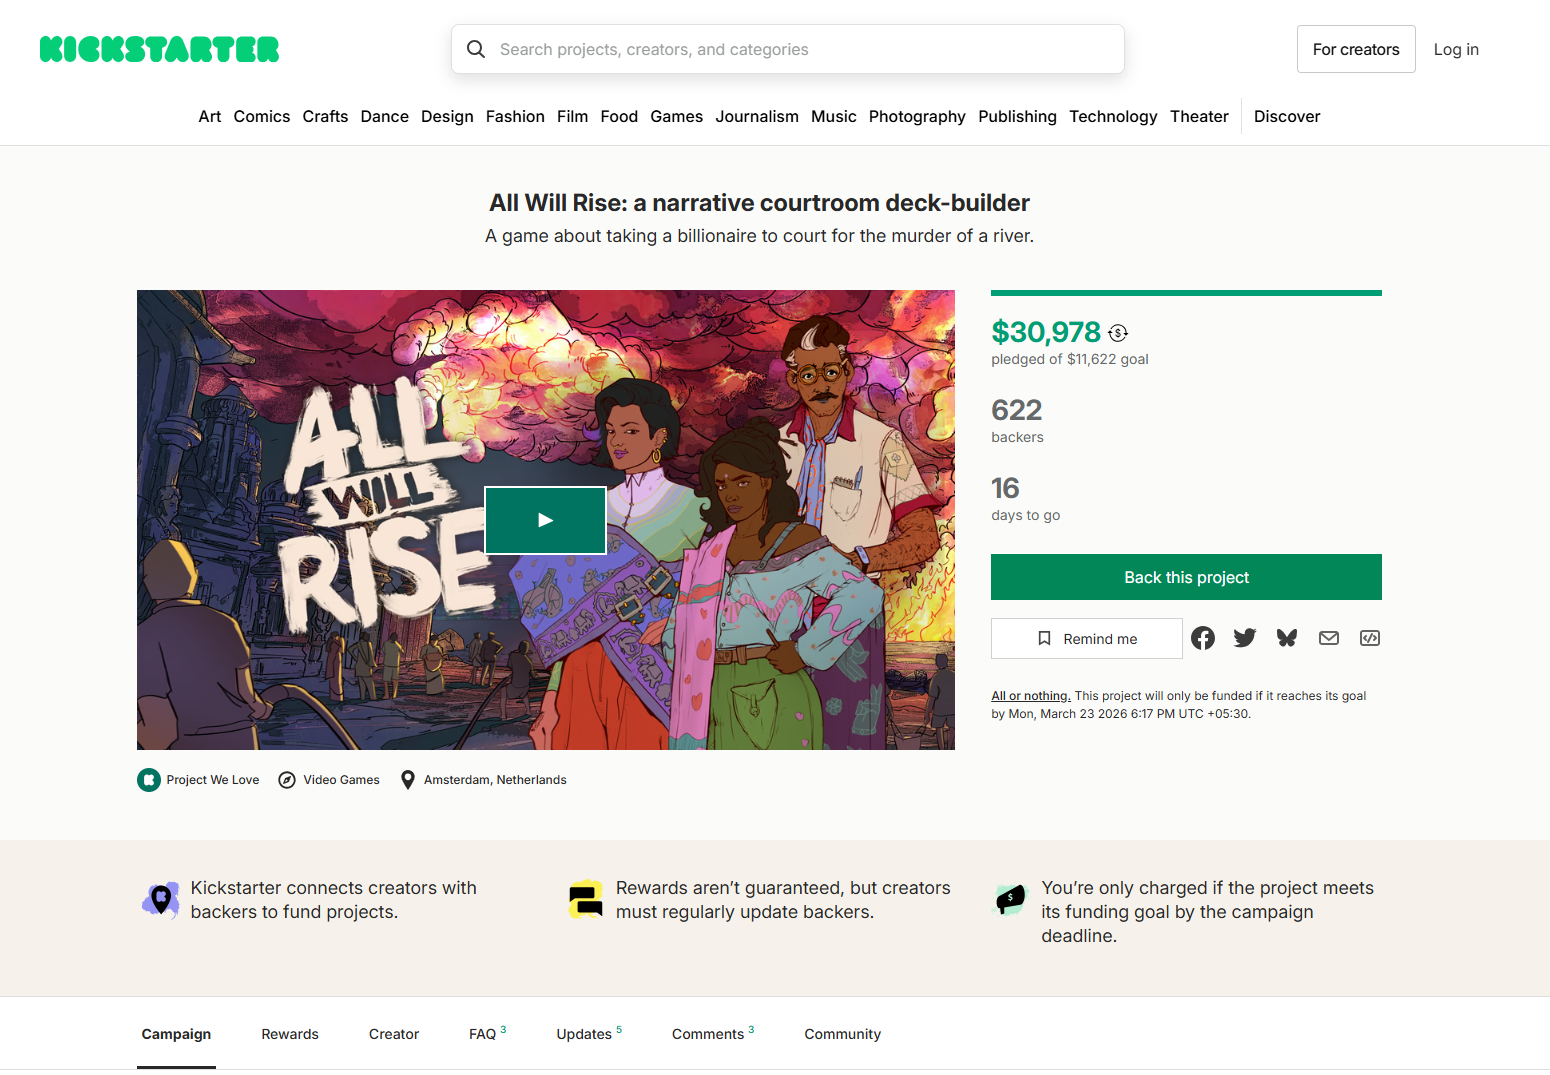
All Will Rise: A narrative courtroom deck-builder
All Will Rise is a narrative courtroom deck-building video game funded via Kickstarter. Players lead a team investigating environmental harm and build arguments through card-based mechanics to prosecute a powerful corporation for destroying a river, combining investigation, strategy and storytelling in a political crime-thriller setting.
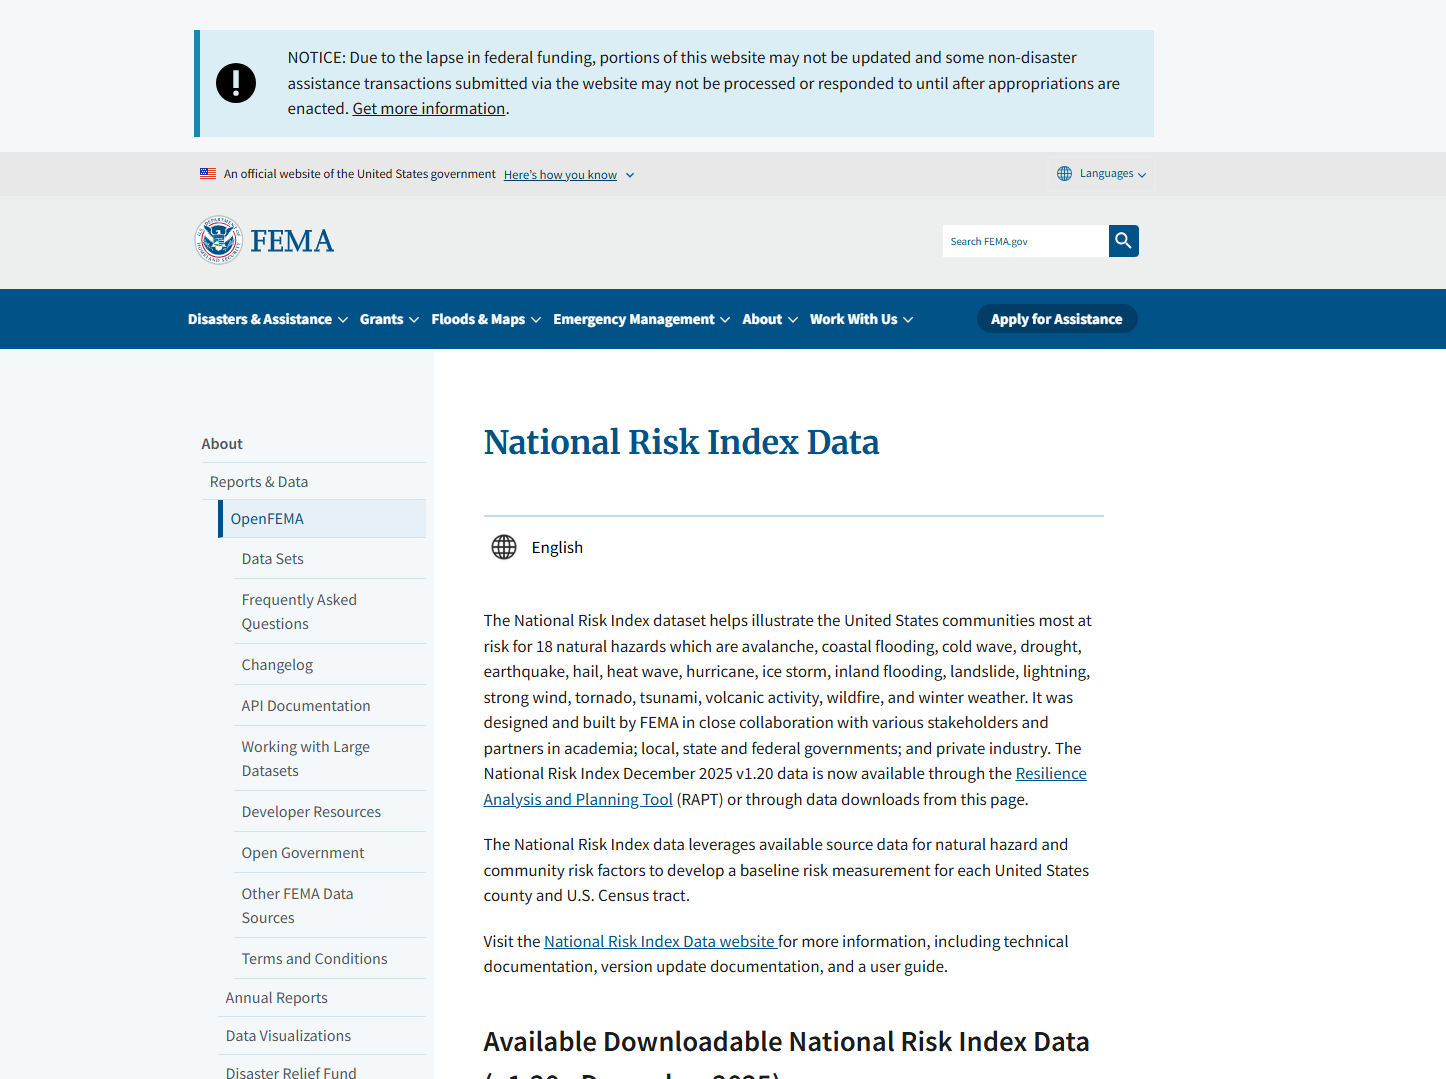
OpenFEMA National Risk Index Data
The OpenFEMA National Risk Index Data is a dataset that shows which United States communities are most at risk from 18 natural hazards, using measures of expected annual loss, social vulnerability and community resilience. Data are available for counties and Census tracts and can be downloaded for analysis.
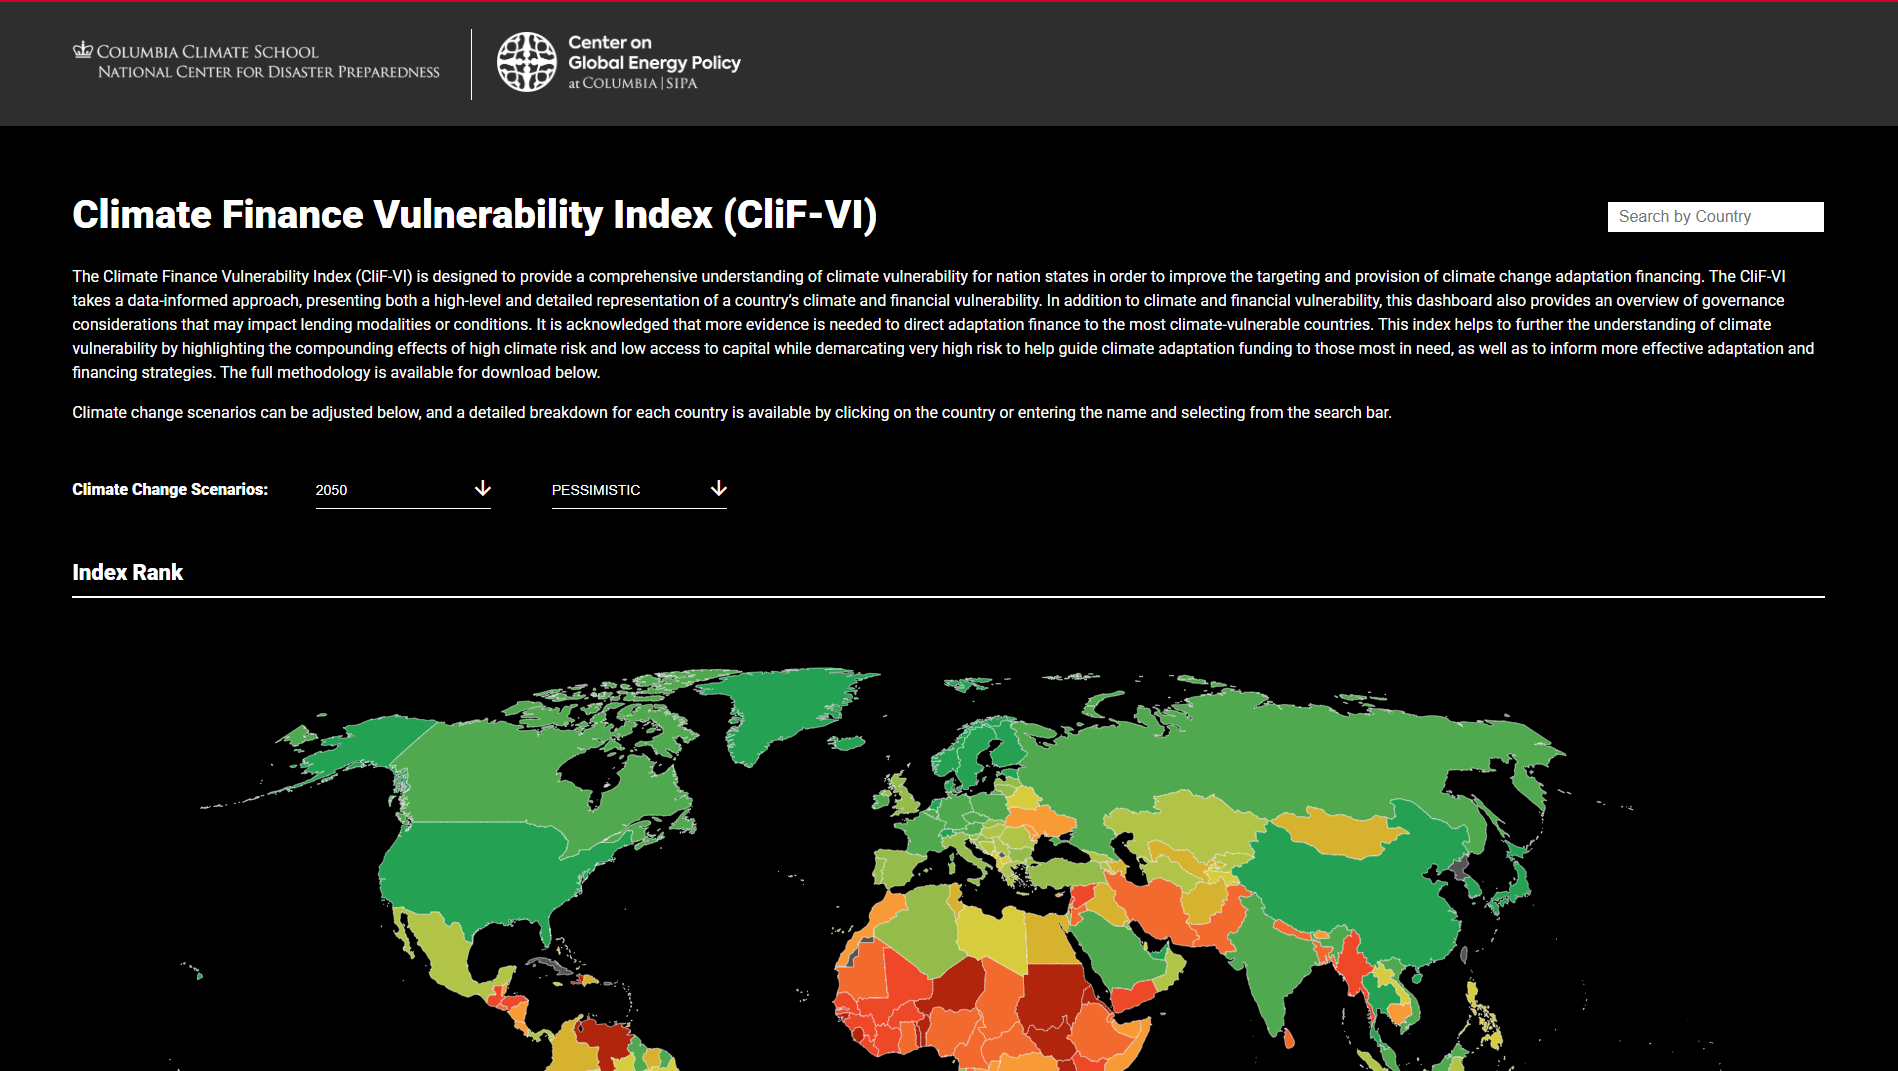
Climate Finance Vulnerability Index (CliF-VI)
The Climate Finance Vulnerability Index (CliF-VI) is a data-driven global tool that assesses nations’ climate risk alongside their financial capacity to respond, helping guide adaptation financing. It combines climate, financial and governance indicators in an interactive dashboard to inform equitable allocation of climate adaptation funds.
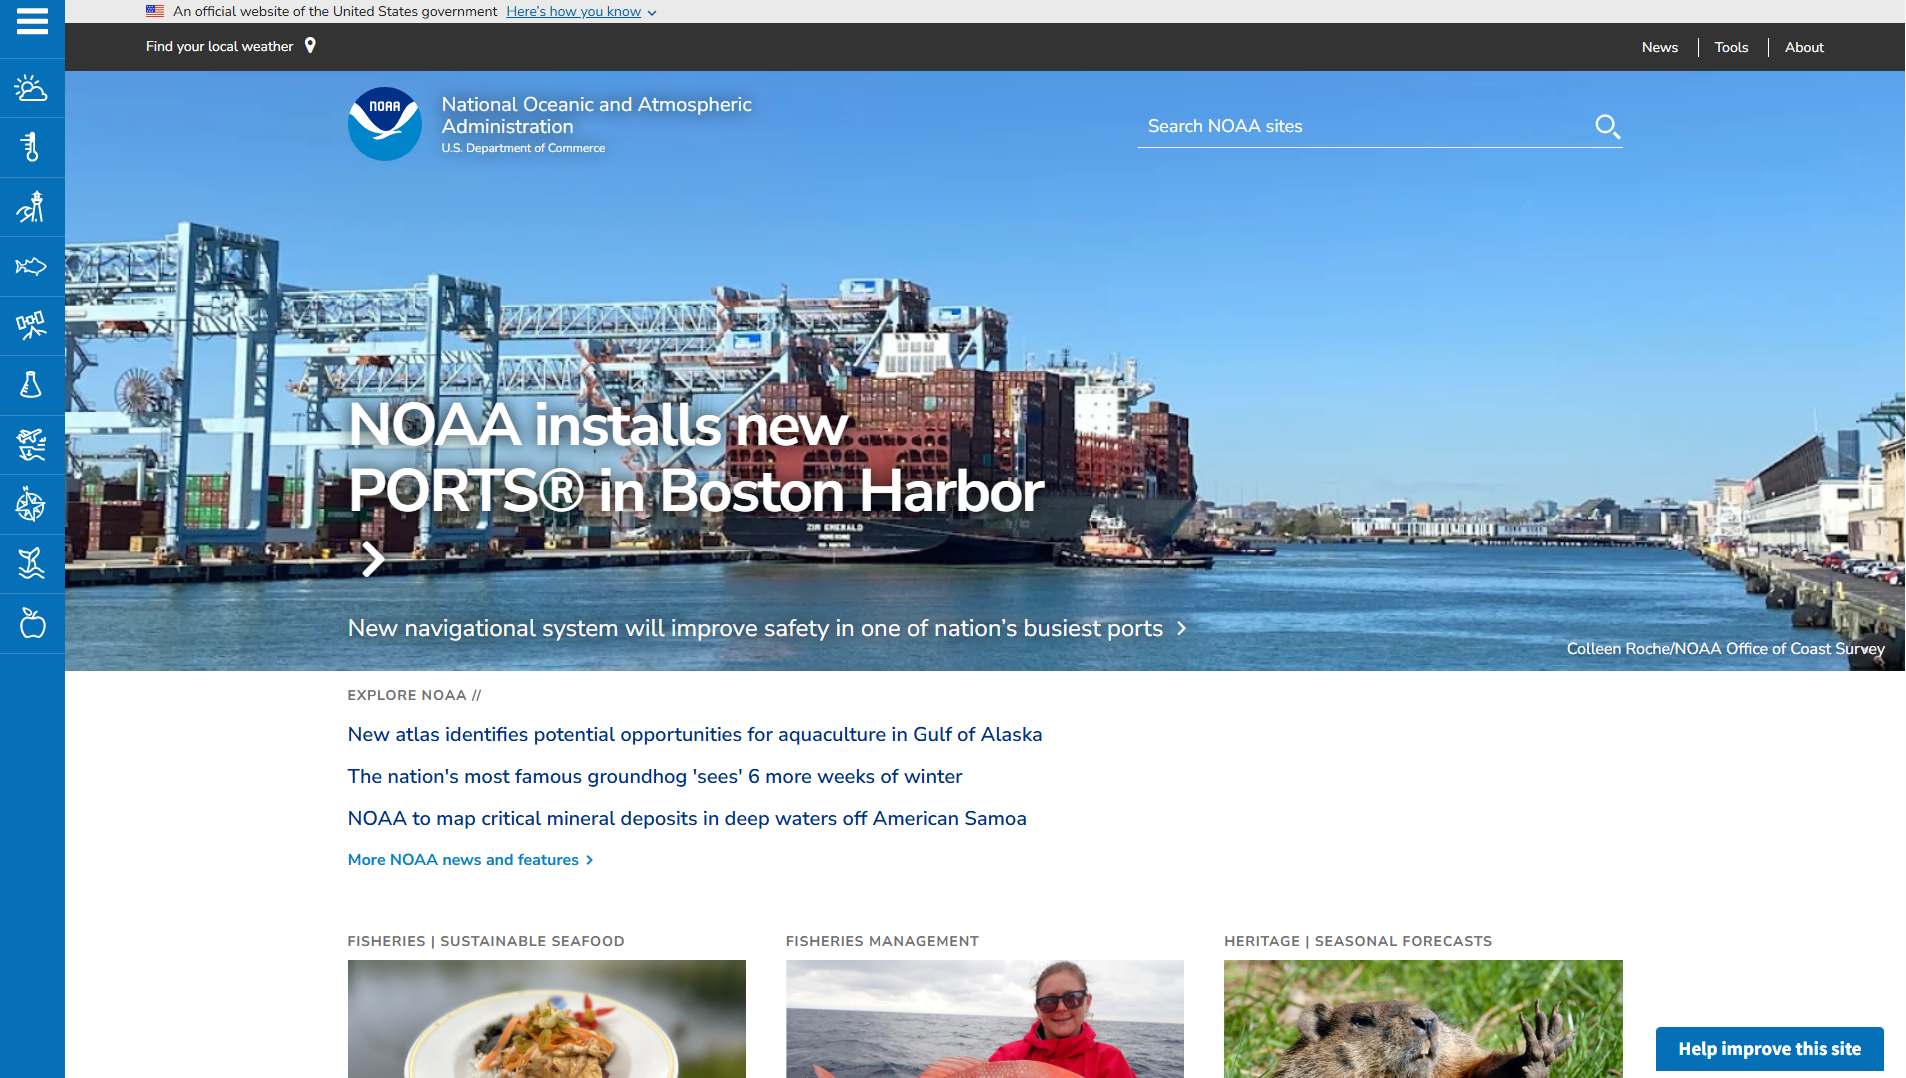
National Oceanic & Atmospheric Administration (NOAA)
The National Oceanic and Atmospheric Administration (NOAA) is a United States government scientific agency offering weather, climate, ocean, and coastal data, forecasts and warnings. It supports environmental monitoring, severe weather preparedness, marine resource management and global observation services.
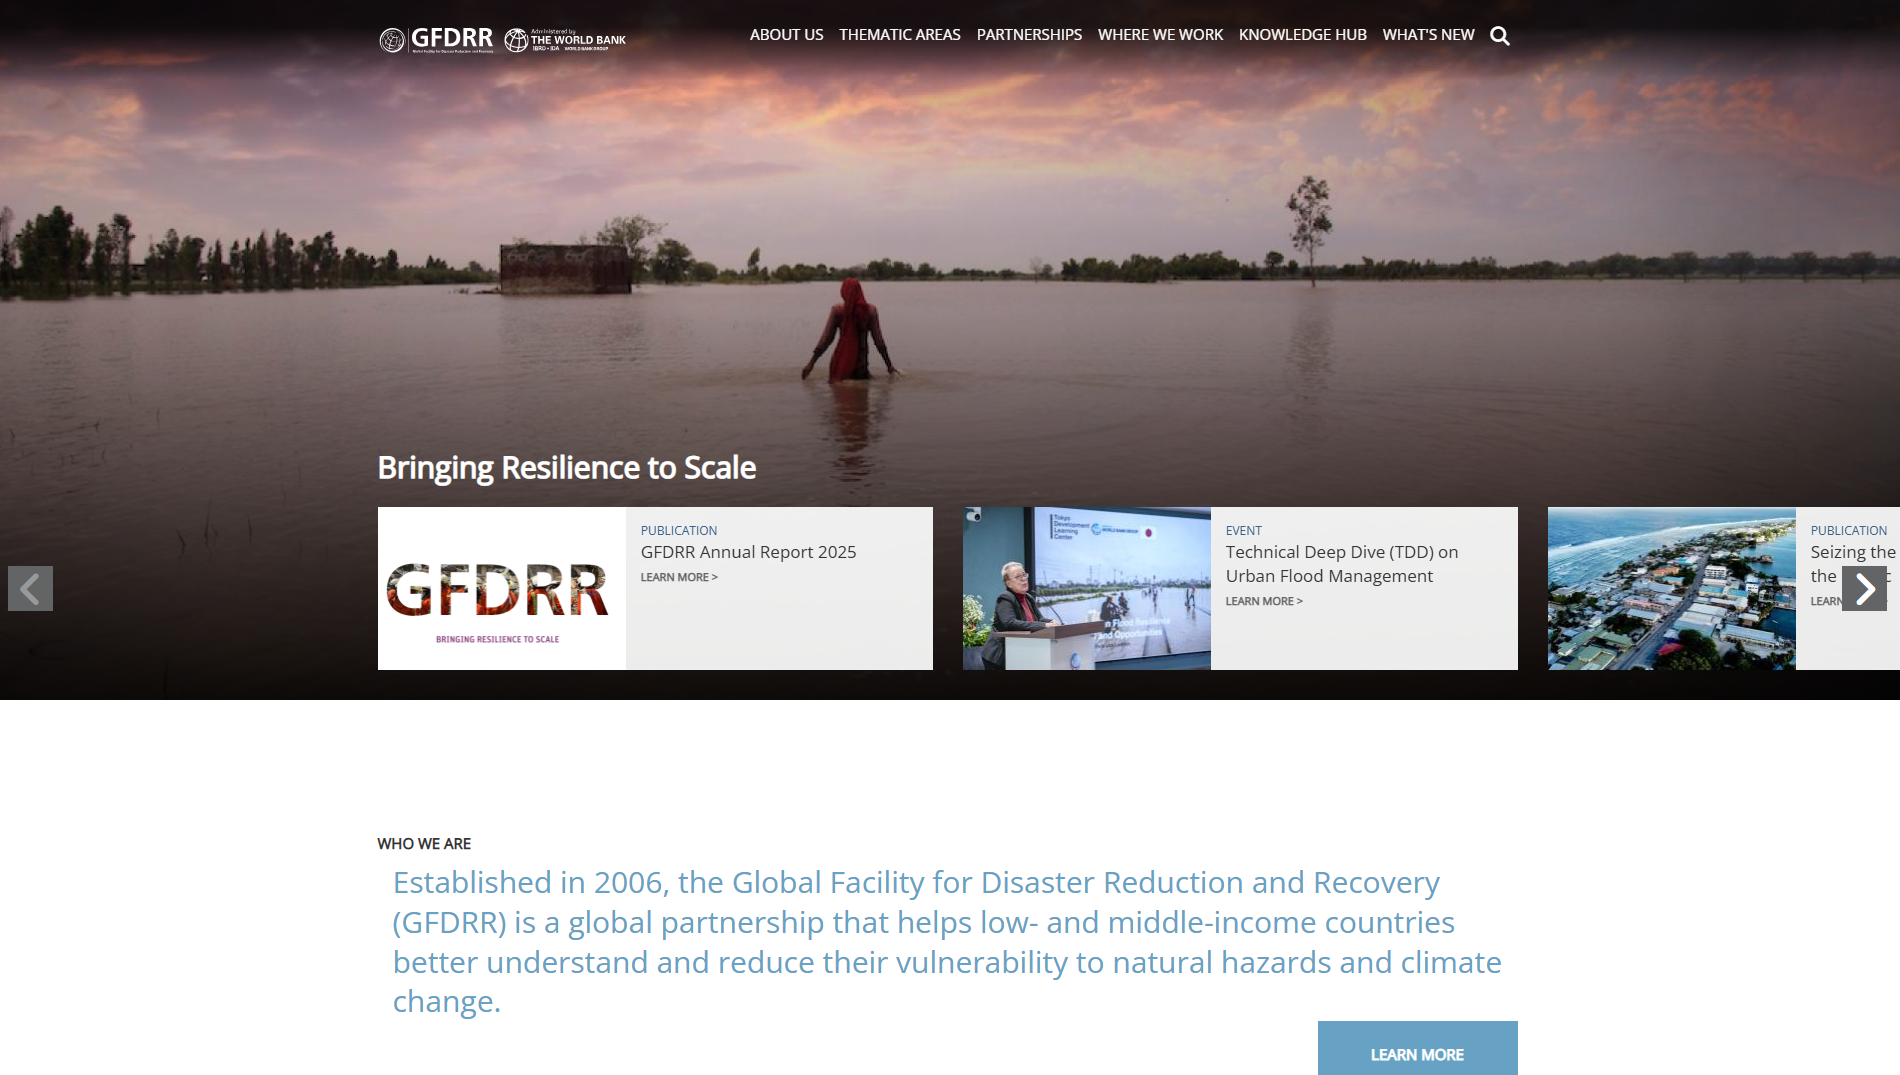
Global Facility for Disaster Reduction and Recovery (GFDRR)
The Global Facility for Disaster Reduction and Recovery (GFDRR) is a World Bank-managed, multi-donor partnership that provides grants, technical assistance and tools to help low- and middle-income countries understand, manage and reduce disaster and climate risks. It supports resilience planning, risk analytics and disaster risk management integration into development.
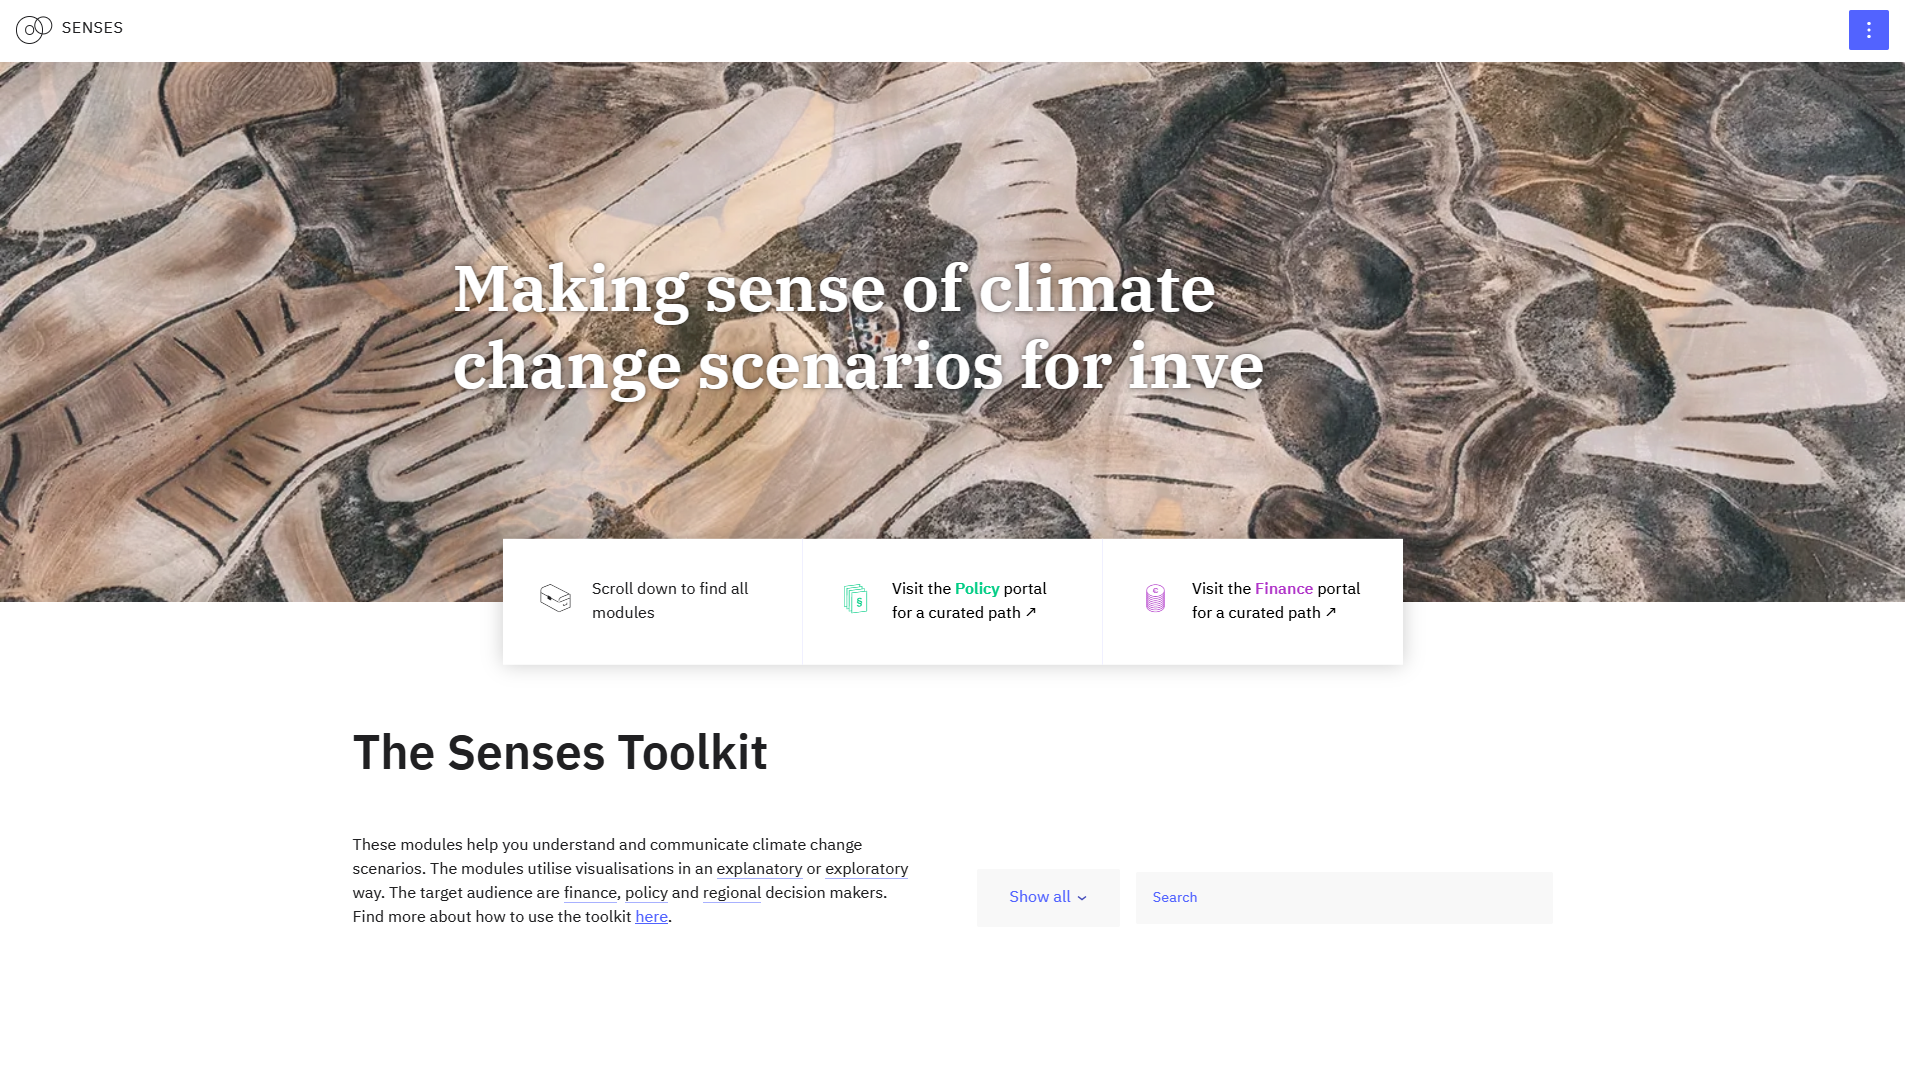
SENSES Toolkit
The SENSES Toolkit is an interactive online platform offering modules to learn about, visualise and explore climate change scenarios. It supports decision-makers in understanding scenario approaches, climate impacts, mitigation and adaptation pathways, with practical guidelines for policy, finance and regional users.
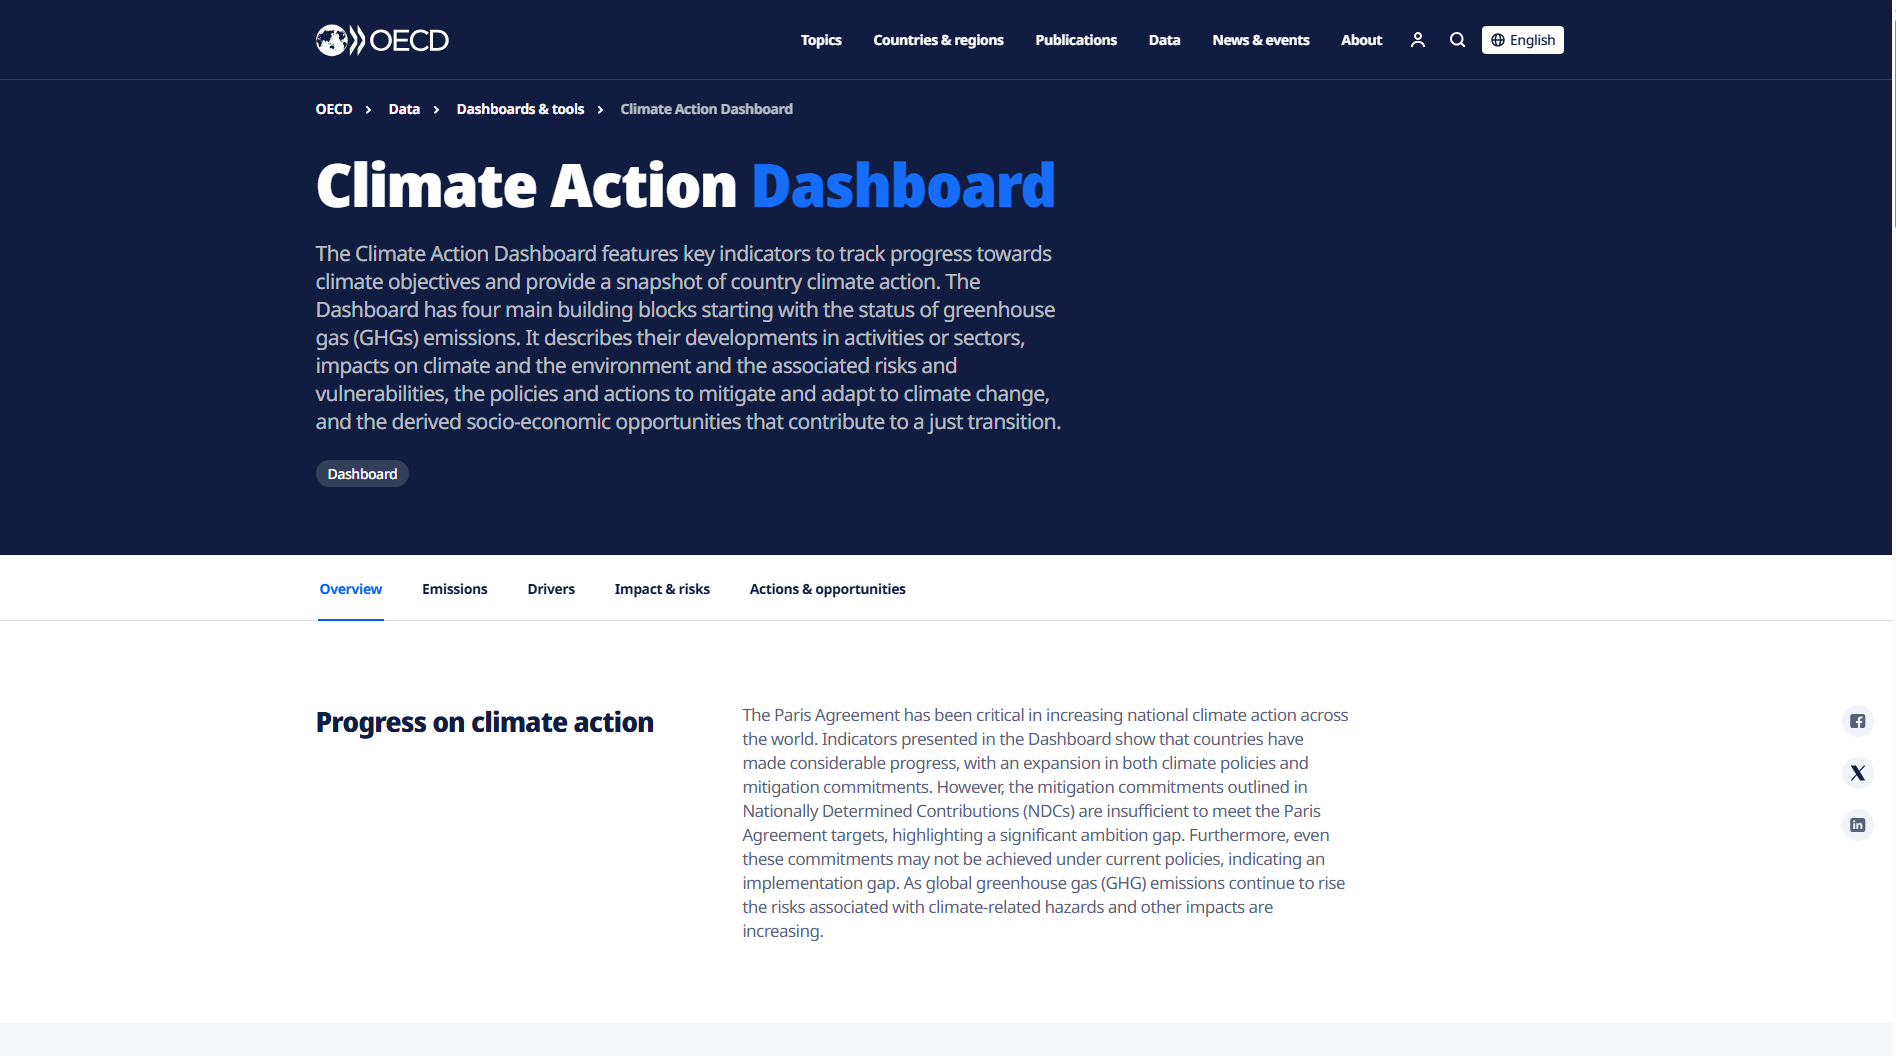
OECD Climate Action Dashboard
The OECD Climate Action Dashboard is an interactive tool showing key indicators of national climate action and progress towards objectives such as net-zero greenhouse gas emissions. It provides comparable, country-level data to track climate mitigation, emissions trends and policy responses.
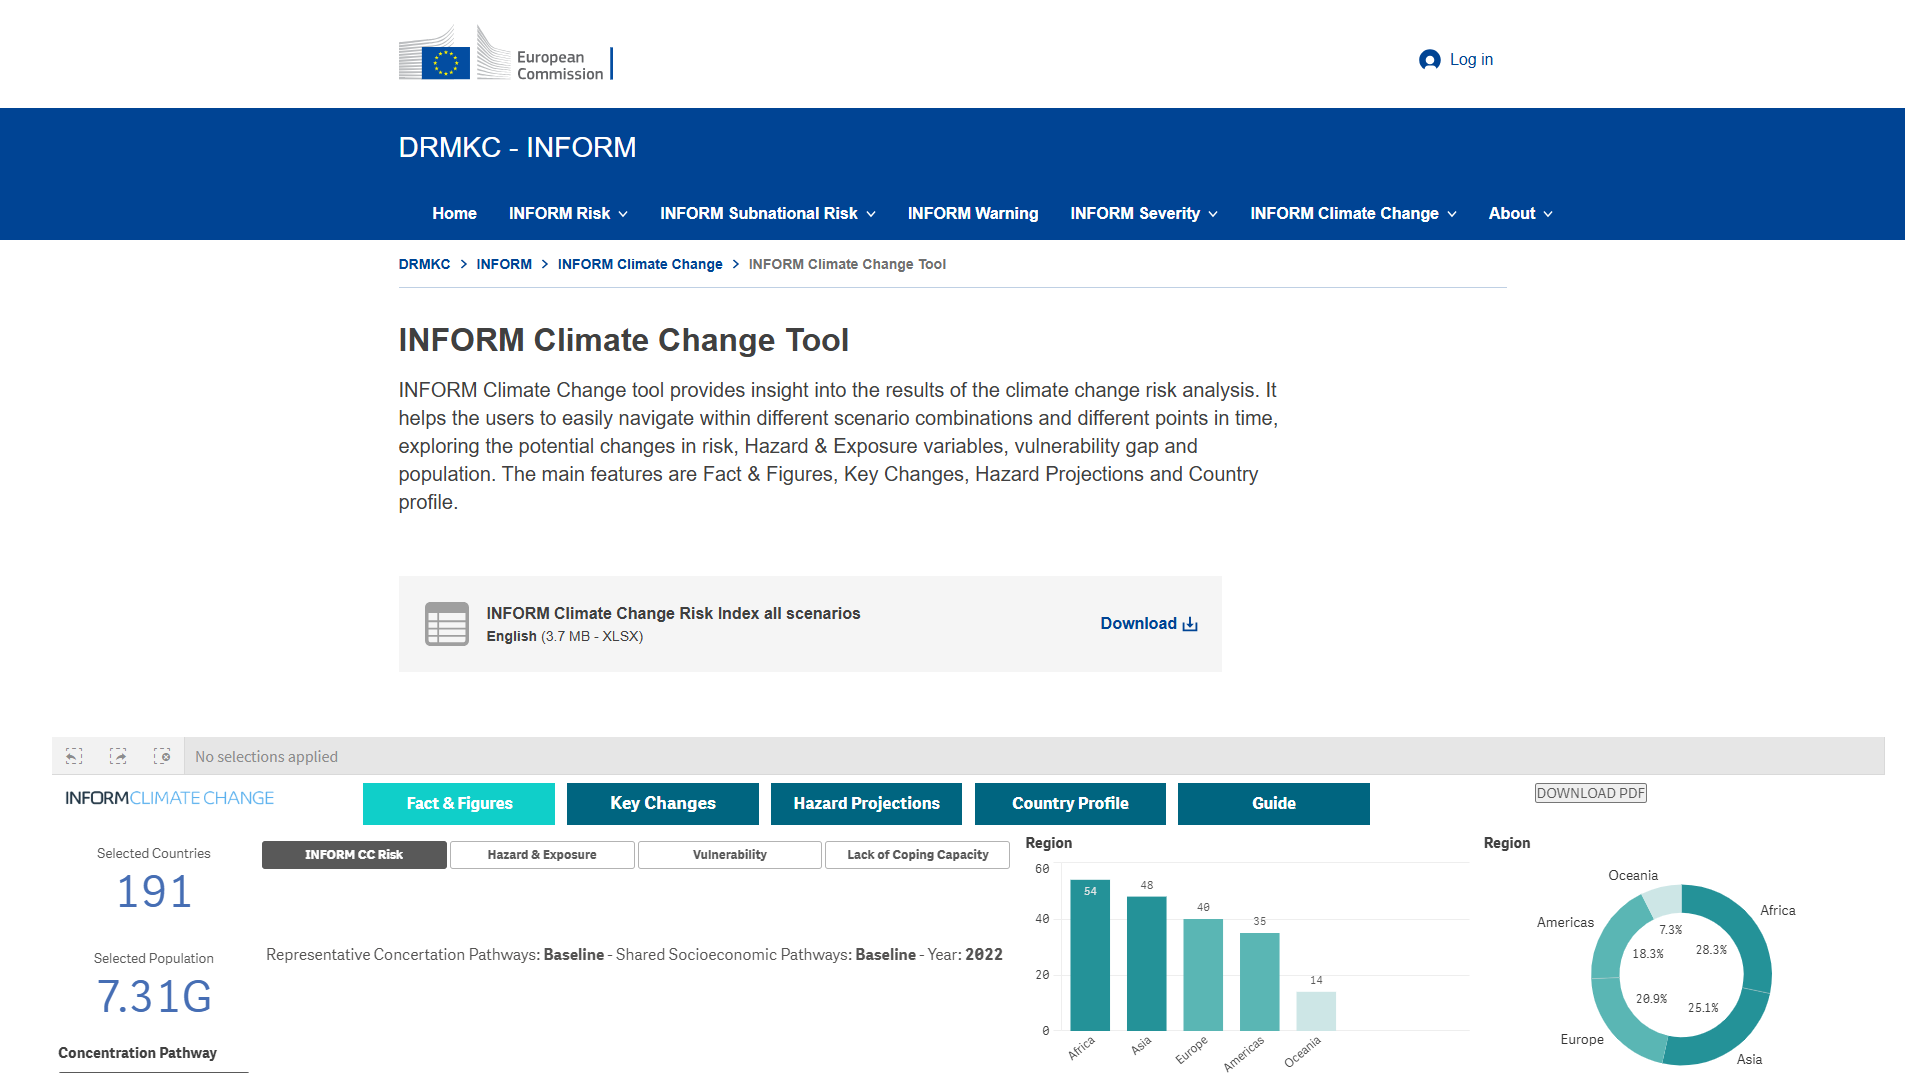
INFORM Climate Change tool
INFORM Climate Change Tool visualises climate-change risk projections, letting users explore future risk, hazard & exposure variables, vulnerability gaps and population changes under different scenarios and time points. It supports analysis of climate impacts on humanitarian and disaster risk via scenario comparison and country profiles.
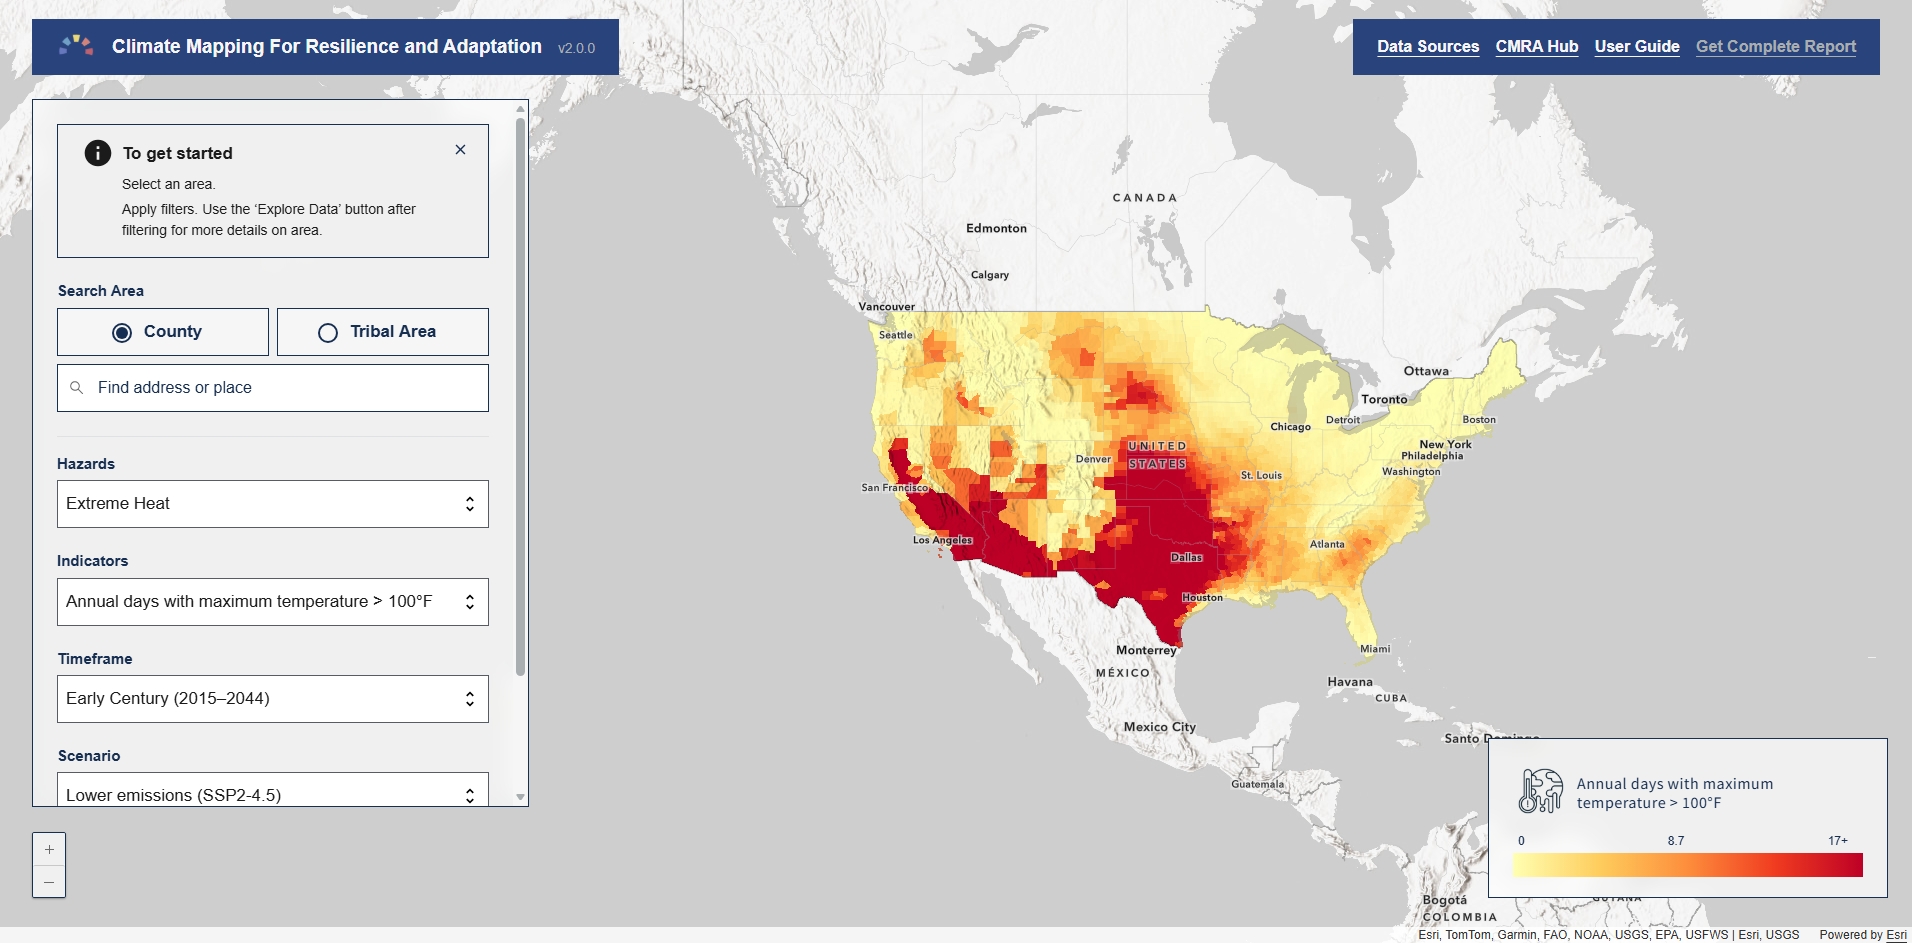
Climate Mapping for Resilience and Adaptation
Climate Mapping for Resilience and Adaptation (CMRA) is a portal that helps users assess local exposure to climate-related hazards using federal data, enabling analysis of past, present and projected climate conditions to support risk assessments and resilience planning.
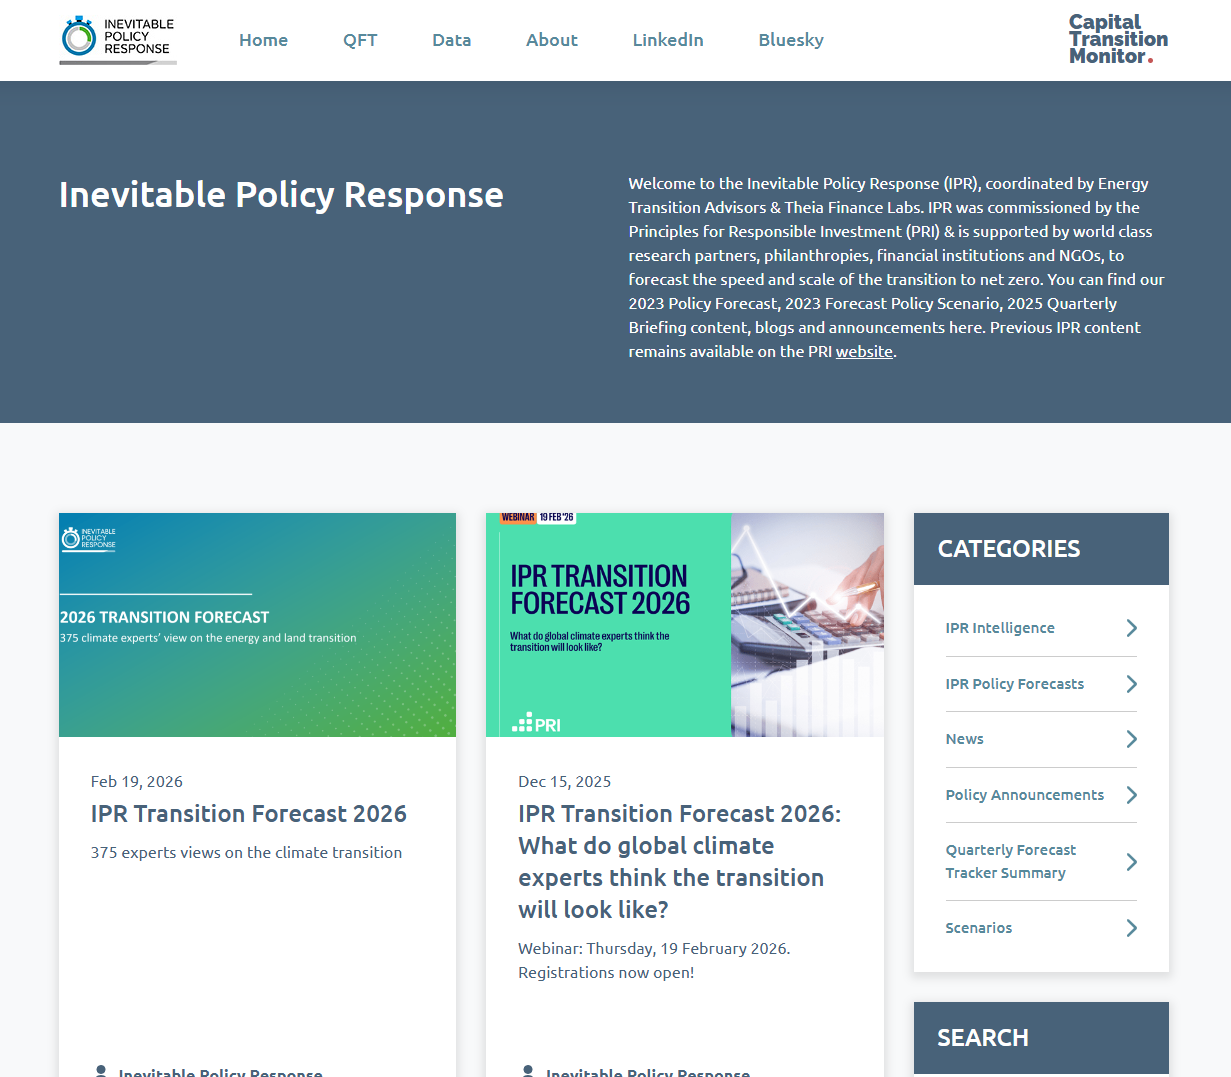
Inevitable Policy Response
Inevitable Policy Response (IPR) on ipr.transitionmonitor.com is a climate policy data and forecast platform that tracks global policy developments, scenarios and variables to help investors assess climate transition risk and alignment of portfolios with likely policy outcomes. It is supported by PRI and research partners.
Inevitable Policy Response (IPR) Transition Monitor is an online climate policy data platform tracking expected government climate actions by country and sector. It helps investors assess transition risk, forecast policy impacts and align portfolios with likely policy pathways to net-zero, based on expert forecasts and quarterly updates.
Inevitable Policy Response (IPR) Transition Monitor is an online climate policy data platform tracking expected government climate actions by country and sector. It helps investors assess transition risk, forecast policy impacts and align portfolios with likely policy pathways to net-zero, based on expert forecasts and quarterly updates.
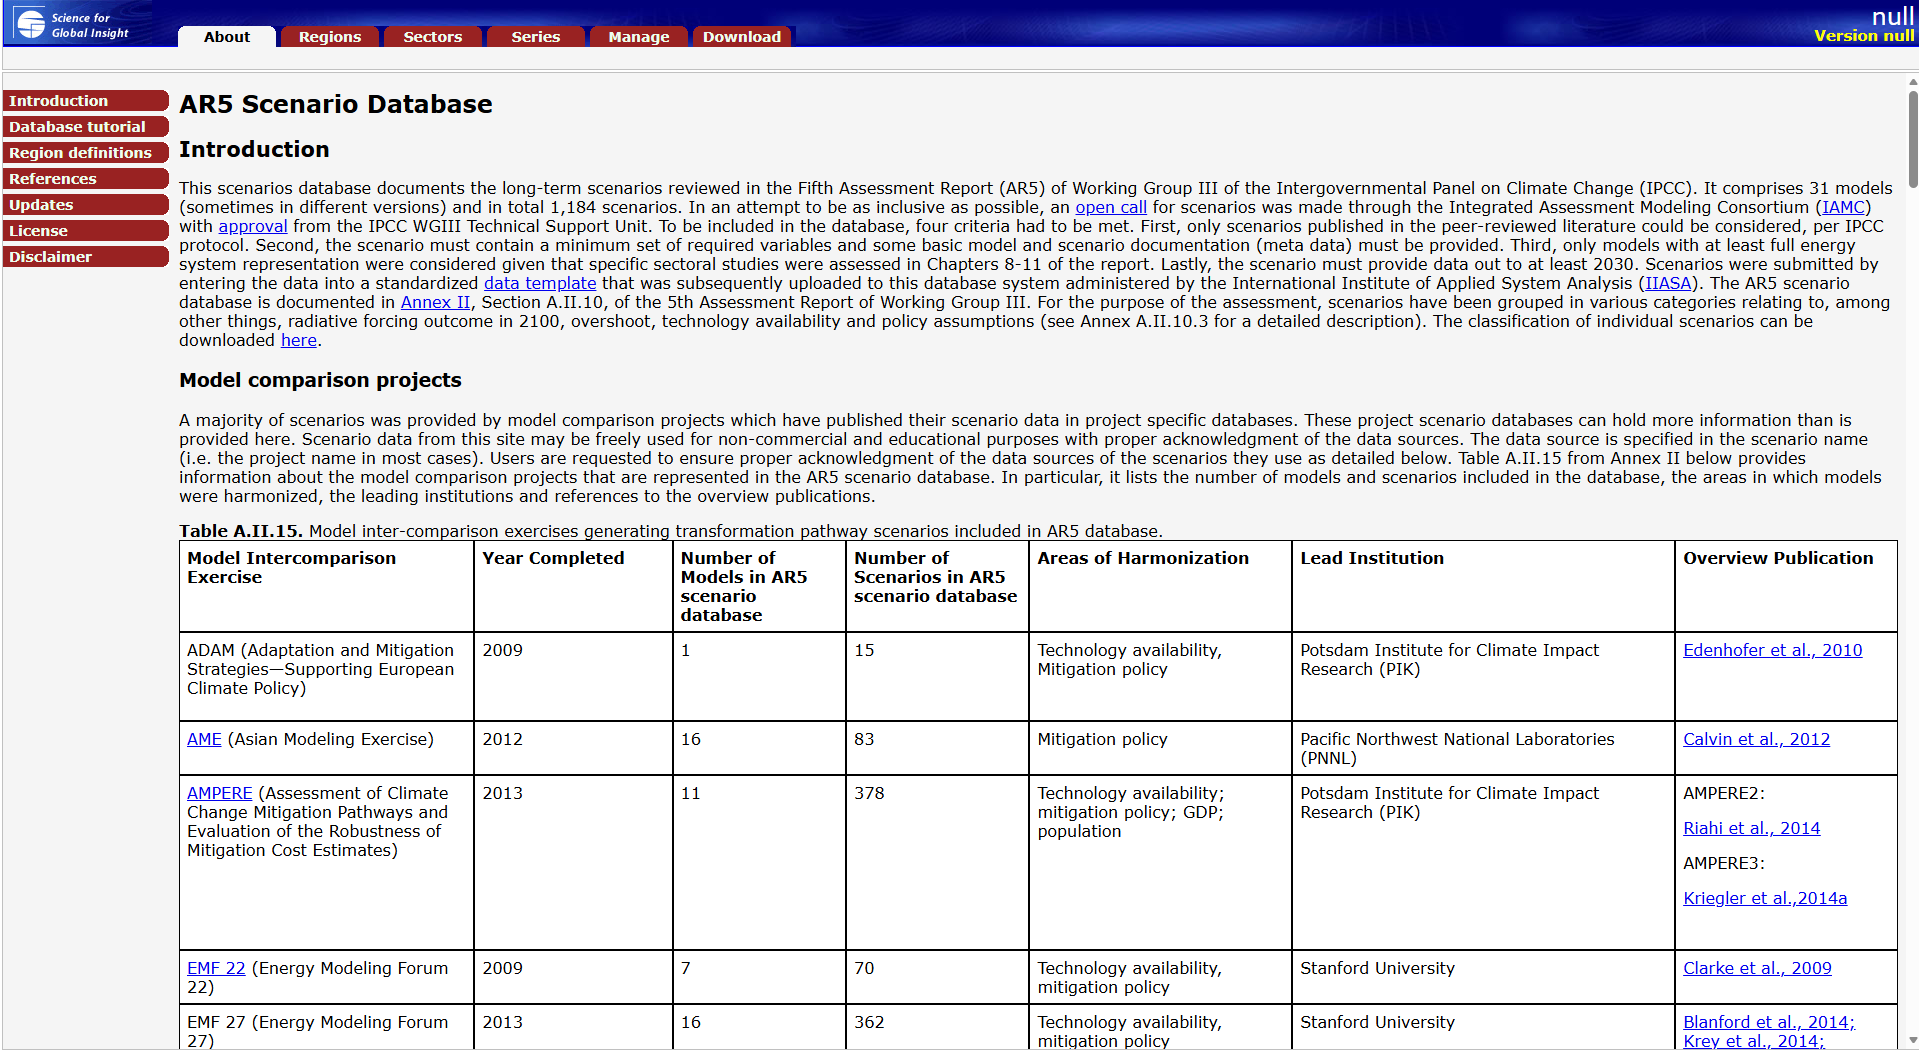
AR5 Scenario Database
The IPCC AR5 Scenario Database, hosted by IIASA, provides access to long-term emissions and mitigation scenarios assessed in Working Group III’s Fifth Assessment Report. It enables users to explore modelled pathways on climate change, energy systems and greenhouse gas emissions, supporting analysis of transition risks and policy-relevant climate outcomes.
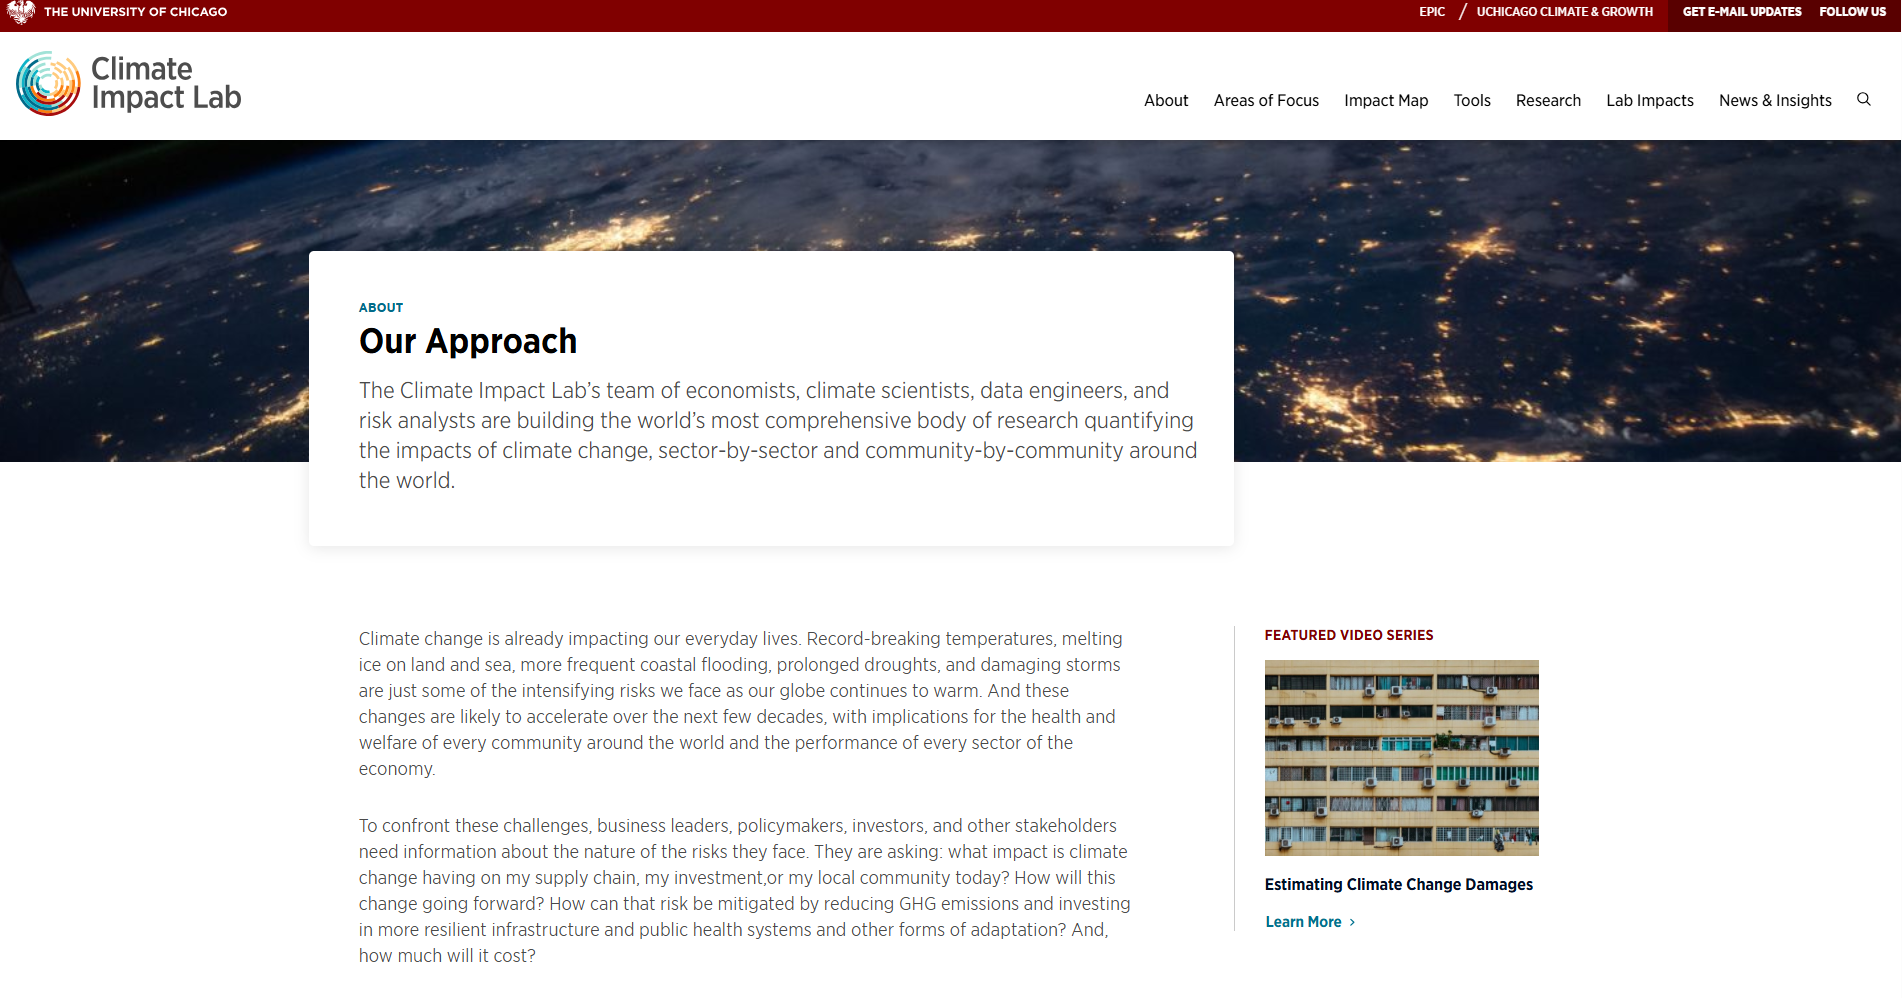
Climate Impact Lab
Climate Impact Lab uses historical climate and socioeconomic data with evidence-based, data-driven analysis to quantify climate change impacts and economic costs at local and sector levels, informing policymakers, investors and business decisions, including an empirically-derived estimate of the social cost of carbon.
Carbon Tracker Initiative
Carbon Tracker’s Reports page hosts research analysing how supply, demand and climate policy affect fossil-fuel exposed companies and markets. It provides scenario analysis, methodological frameworks and sector-specific insights for investors and policymakers on climate-related financial risk and the energy transition.
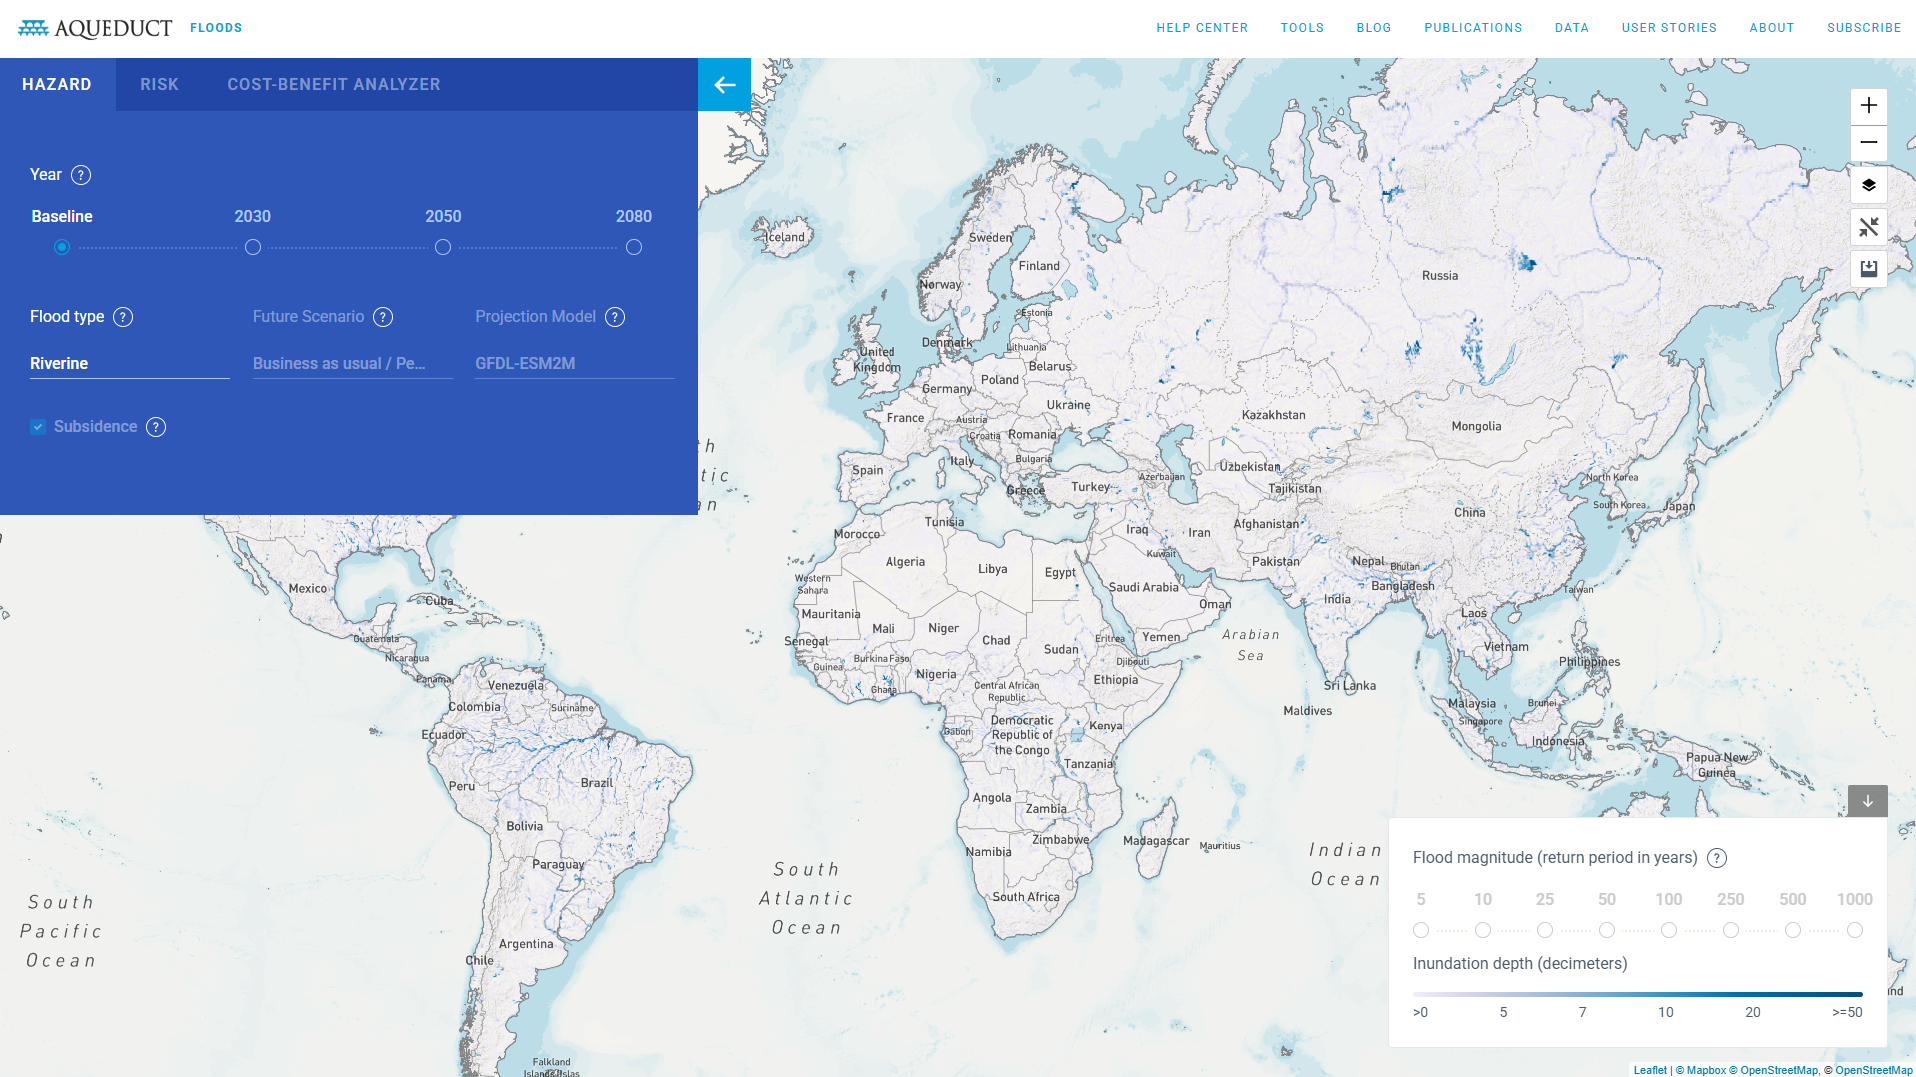
AQUEDUCT Floods
Aqueduct Floods is an interactive tool by WRI that maps current and projected riverine and coastal flood risk globally. It enables users to assess exposure, urban damage, and economic impacts under different climate scenarios, supporting risk analysis, resilience planning, and investment decision-making at country and sub-national levels.