The Climate Shift Index Global Map is an interactive tool that visualises global climate factors. Developed by Climate Central, the tool features dedicated sections for air, ocean, and humid heat variables. For finance professionals, this tool provides a visual geographic resource to contextualise daily environmental changes and exposure risk across different regions.
Organisation behind the tool
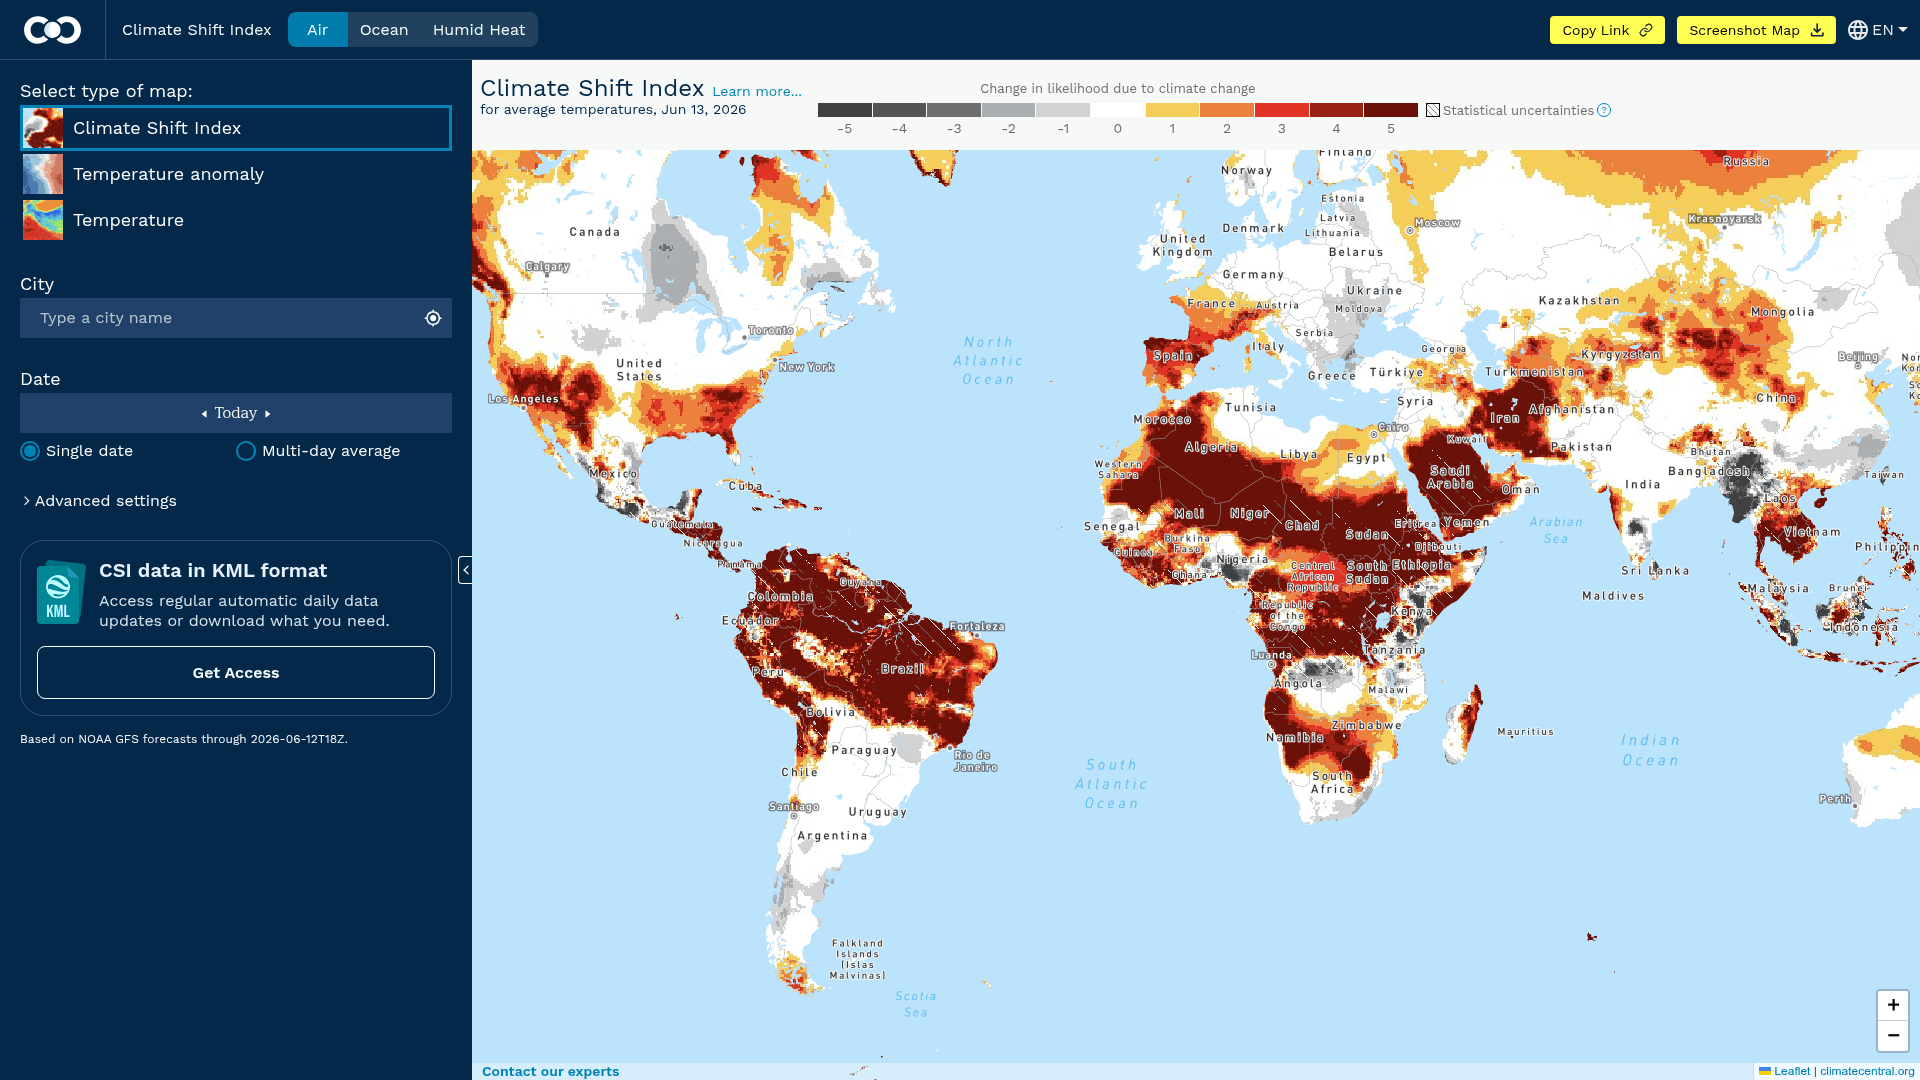
The Climate Shift Index is developed and hosted by Climate Central, utilising Mapbox and Leaflet technologies for its map interface.
What the tool does
The key functions of the Climate Shift Index Global Map include:
- Displaying spatial datasets related to air, ocean, and humid heat climate factors.
- Providing interactive navigation options to zoom in and out of specific global geographic regions.
- Providing a contact mechanism to connect users with Climate Central experts for further explanations and interviews.
Target audience
The tool is designed for the general public, researchers, policy professionals, and media representatives who require geographic visualisations of climate factors and access to climate experts.
Relevance to finance professionals
Finance professionals can apply the Climate Shift Index in several key areas:
- Risk assessment: The tool visualises environmental data across air, ocean, and humid heat, helping analysts identify geographic exposure to environmental hazards and anomalies.
- ESG analysis: It offers daily updated maps of climate factors that can support environmental reporting and spatial risk analysis.
- Market/commodity insights: Monitoring temperature, ocean, and humid heat changes provides critical context for climate-sensitive sectors like agriculture and fisheries.
- Investment context: Serves as a high-level monitoring tool to understand spatial environmental changes in target asset locations.