Historical redlining and cumulative environmental impacts across the United States
This study analyses 202 US cities, linking historic redlining to higher present-day cumulative environmental burdens. Using EJScreen data and modelling, it finds redlined neighbourhoods face significantly greater combined pollution exposures, particularly from traffic, hazardous waste and wastewater sites, with strongest disparities in western regions.
Please login or join for free to read more.
OVERVIEW
Introduction
This study examines whether historically redlined neighbourhoods in the United States continue to experience disproportionate cumulative environmental burdens. While prior research links redlining to individual hazards, evidence on overlapping, simultaneous exposures has been limited. The authors assess whether multiple environmental hazards co-occur in historically marginalised areas and whether this contributes to persistent environmental health disparities.
Methods And Materials
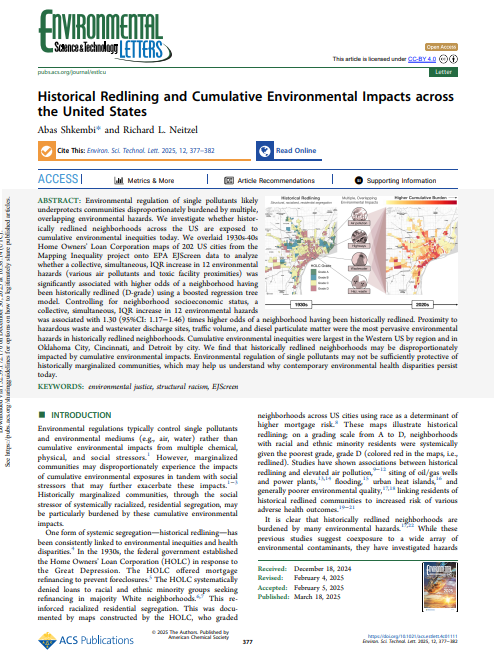
The analysis combines historical Home Owners’ Loan Corporation (HOLC) maps from the 1930s–40s for 202 US cities with contemporary Environmental Protection Agency (EPA) EJScreen data. A total of 8,765 HOLC-defined neighbourhoods were analysed, of which 23.5% were classified as historically redlined (D-grade). Twelve environmental hazards were assessed, including air toxics cancer risk, diesel particulate matter, traffic volume, toxic releases, and proximity to hazardous waste, wastewater discharge, Superfund, and industrial facilities. Hazards were converted to within-city percentiles to account for inter-city differences. Socioeconomic controls included neighbourhood shares of low-income residents and residents without a high school diploma. A gradient boosted regression tree model, with 200 bootstrapped iterations, tested whether simultaneous increases across hazards were associated with higher odds of a neighbourhood being historically redlined. Regional and metropolitan-level models were also estimated to identify geographic variation.
Results
Historically redlined neighbourhoods exhibited significantly higher exposure to most environmental hazards compared with non-redlined areas. Descriptive analysis showed that D-grade neighbourhoods were overrepresented among those with the highest cumulative environmental burden. Although redlined neighbourhoods account for 23.5% of all neighbourhoods, they represented 64.6% of areas in the 80th–90th percentile of cumulative hazard exposure. A simultaneous interquartile range increase across the 12 hazards was associated with 1.30 times higher odds (95% CI: 1.17–1.47) of a neighbourhood having been historically redlined, after controlling for socioeconomic factors. The most pervasive hazards were proximity to hazardous waste sites, wastewater discharge sites, high traffic volumes, and elevated diesel particulate matter. Geographic disparities were substantial. By region, cumulative inequities were strongest in the Western United States, where the odds ratio reached 2.33 (95% CI: 1.53–3.63). At the city level, the largest disparities were observed in Oklahoma City, Cincinnati, and Detroit. Oklahoma City showed particularly extreme results, with odds ratios exceeding 30, though estimates were associated with wide confidence intervals.
Discussion
The findings demonstrate that historically redlined neighbourhoods are not only exposed to isolated hazards but are disproportionately burdened by multiple, overlapping environmental risks. These cumulative exposures persist even after adjusting for current socioeconomic status, suggesting a lasting legacy of structural discrimination in housing and urban development. The concentration of hazardous waste facilities, wastewater discharge sites, traffic infrastructure, and diesel emissions aligns with earlier environmental justice research on discriminatory siting practices. The variation across cities indicates that cumulative environmental injustice is shaped by local histories of zoning, industrial development, urban renewal, and segregation. The results help explain why environmental health disparities persist despite pollutant-specific regulation. Regulating individual pollutants or media in isolation may fail to address the combined risks faced by historically marginalised communities.
Limitations
The study relies on environmental indicators drawn from different years and aggregated to HOLC-defined neighbourhoods, which may introduce measurement error. Not all relevant hazards were included, such as noise, light pollution, or access to green space. Smaller metropolitan areas were excluded from city-specific modelling due to limited sample sizes, and confidence intervals were wide in some locations, partly reflecting gentrification and changing socioeconomic conditions.
Implications
The findings support policy approaches that explicitly consider cumulative environmental impacts rather than single pollutants. Identifying cities with the most severe cumulative burdens, particularly Oklahoma City, Cincinnati, and Detroit, may help prioritise regulatory attention, environmental monitoring, and resource allocation. Incorporating historical context into environmental decision-making could improve the effectiveness of environmental justice and public health interventions.