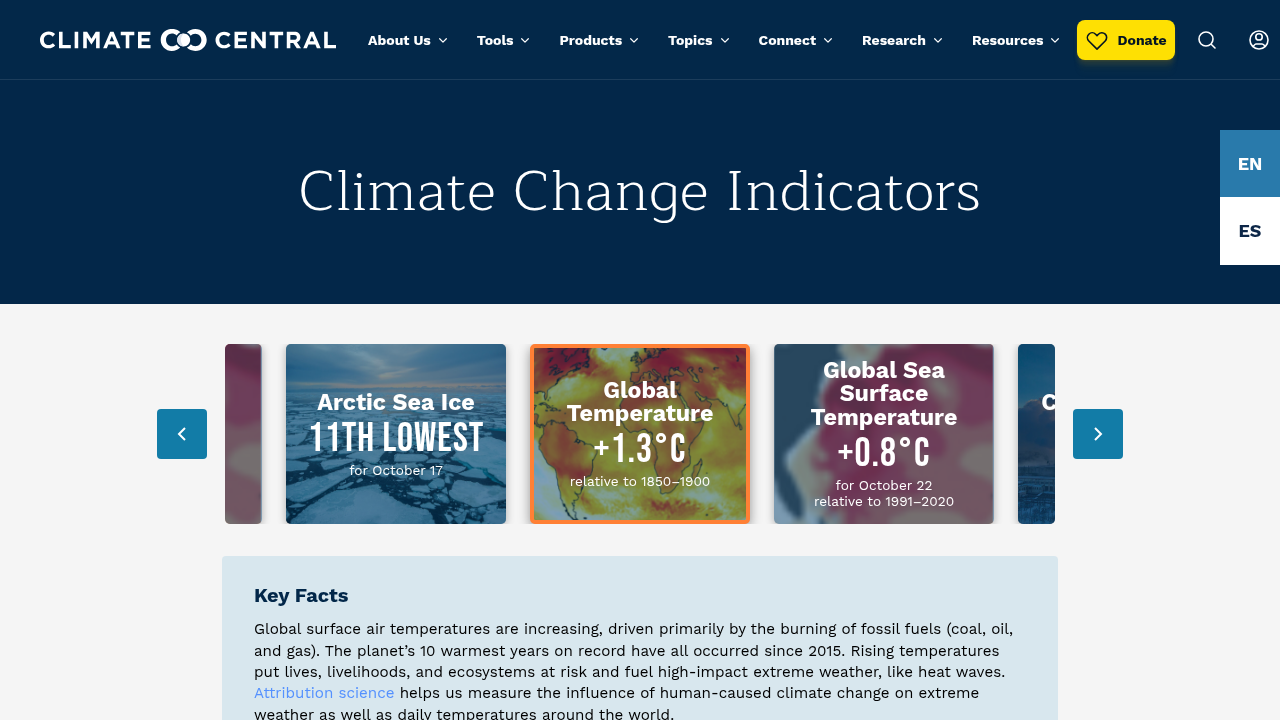
Climate Change Indicators Dashboard
A real-time global dashboard from Climate Central providing data visualisations on key climate indicators, attribution science, and extreme weather impacts to help professionals assess environmental risks and infrastructure vulnerability.
Please login or join for free to read more.

OVERVIEW
The Climate Change Indicators Dashboard is a real-time data visualisation platform that provides a snapshot of global environmental shifts. Developed to track and quantify the role of climate change in weather events and long-term trends, the tool offers finance professionals immediate access to key metrics and attribution science. It serves as a centralized hub for monitoring how the planet is changing and understanding the drivers behind extreme weather phenomena.
Organisation behind the tool
The dashboard is developed and maintained by Climate Central, an independent group of scientists and communicators that research and report the facts about our changing climate and its impact on the public.
What the tool does
- Provides real-time data visualisations of key global climate indicators.
- Utilises attribution science to quantify the influence of climate change on daily local weather, ocean temperatures, and tropical cyclones.
- Offers interactive mapping through the Climate Shift Index to track atmospheric and oceanic shifts.
- Integrates historical data on billion-dollar weather and climate disasters to show frequency and cost trends.
- Features photorealistic visualisations of flood risk from sea level rise and storm surge events.
Target audience
The primary audience includes finance professionals, underwriters, infrastructure planners, journalists, policymakers, and researchers seeking to localise climate impacts and assess environmental risk.
Relevance to finance professionals
- Risk assessment – Evaluation of building-level elevation data and coastal flood layers for high-accuracy underwriting and pricing decisions.
- ESG analysis – Access to real-time environmental metrics and attribution resources for robust sustainability reporting and disclosures.
- Portfolio screening – Analysis of natural hazard significance and flood projections across entire asset portfolios.
- Investment context – Insight into the economic costs of billion-dollar disasters and long-term sea level rise projections to inform capital and infrastructure planning.