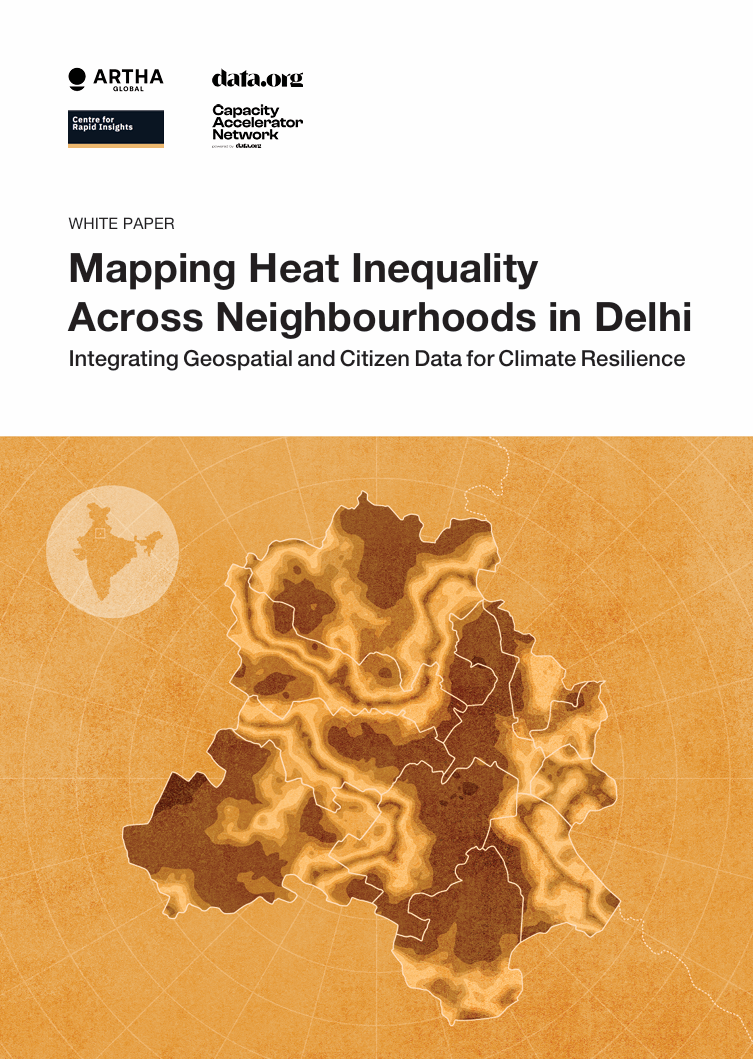
Mapping heat inequality across neighbourhoods in Delhi: Integrating geospatial and citizen data for climate resilience
Delhi heat vulnerability is shaped by neighbourhood density, limited green cover and unequal access to cooling. Using geospatial and household survey data, the report finds higher heat exposure increases illness, sleep disruption and productivity loss, while targeted greening, micro-level heat planning and energy-efficient cooling could improve urban climate resilience.
Please login or join for free to read more.
OVERVIEW
Introduction
The report examines how extreme heat in Delhi interacts with urban density, limited vegetation and unequal access to cooling. India experienced more than 280 heatwave days between March and May 2022, while Delhi recorded its warmest night in six years during April 2025. Existing Heat Action Plans often lack detailed vulnerability assessments, limiting targeted responses.
Neighbourhood conditions such as tree cover, building density and housing quality can shift local temperatures by 2–5°C, disproportionately affecting outdoor workers and lower-income households.
Our unique contribution
The study combines geospatial climate data with household surveys to map heat inequality at neighbourhood level. Researchers surveyed 2,368 households across Delhi during June–July 2025 and integrated this with remote-sensing data on built-up surfaces, vegetation and heat exposure.
The framework evaluates three dimensions: household characteristics, urban form and micro-climate conditions, allowing identification of communities facing the highest exposure and weakest coping capacity.
Methodology
Built-up density was mapped using the GHSL Global Built-Up Surface dataset at 100-metre resolution, while vegetation cover was analysed using MODIS data at 250-metre resolution.
Experienced heat was estimated using ERA5-Land and VIIRS temperature datasets resampled to 1-kilometre resolution to calculate humidity-adjusted heat indices.
Household surveys captured demographics, appliance ownership, energy use, commuting patterns, health impacts and behavioural responses to heat.
Our framework
The framework defines heat vulnerability as the interaction between neighbourhood heat exposure, built environment conditions and socio-economic coping capacity. Dense built-up areas with low vegetation intensify heat retention, while income, occupation and appliance ownership determine households’ ability to adapt.
Key findings
Spatial heat baseline: Factors shaping experienced heat
Increasing built-up area from approximately 25% to 55% increased experienced temperatures by around 0.6°C. Increasing tree cover from 3% to 11% reduced experienced heat by roughly 1°C, indicating vegetation has a stronger cooling effect than the warming effect of urban density.
Coping capacity/ adaptation: Household appliances, cccupation and commute
Sleep disruption increased by 5–6 percentage points following a 3°C rise in experienced heat. Households with air conditioners reported substantially better sleep outcomes, with 31.2% reporting good sleep compared with 13.0% among non-AC households.
AC-owning households spent nearly twice as much on electricity during extreme heat, averaging ₹2,560 monthly compared with ₹1,405 for non-AC households. Wealthier households cooled homes for 12–14 hours daily, while lower-income households lacked both appliances and financial flexibility to increase cooling.
Long outdoor work exposure and extended commuting times further increased vulnerability.
Outcomes: Impact on health and productivity
A 3°C rise in experienced heat corresponded with a 15 percentage point increase in respondents reporting illness lasting more than five days. AC ownership was associated with an 11.6% lower incidence of heat-related illness.
Households missing work due to heat increased from approximately 18% to 28% with a 3°C temperature rise, while AC users reported 18% lower work-loss incidence than non-users.
Respondents reporting changes in mood or mental state increased from roughly 15% to 30% as temperatures increased from 42°C to 45°C.
Policy recommendations
The report recommends micro-level Heat Action Plans supported by citizen surveys and ward-level mapping to identify high-risk communities. It also recommends stronger government data literacy and improved coordination between State Disaster Management Authorities and urban local bodies.
Urban planning measures include expanding green cover, integrating blue-green infrastructure, improving shaded pedestrian routes and promoting climate-responsive housing. Energy recommendations include integrating heatwave forecasting into energy planning, improving appliance efficiency and expanding access to energy-efficient cooling for lower-income households