Library | Resource Types
Online tool/database
Tools and databases are resources designed to help members evaluate the sustainability impact and financial performance of investments or business decisions. Tools allow members to assess impact, model scenarios and enable informed decisions that align with sustainability goals.
Refine
267 results
REFINE
SHOW: 16

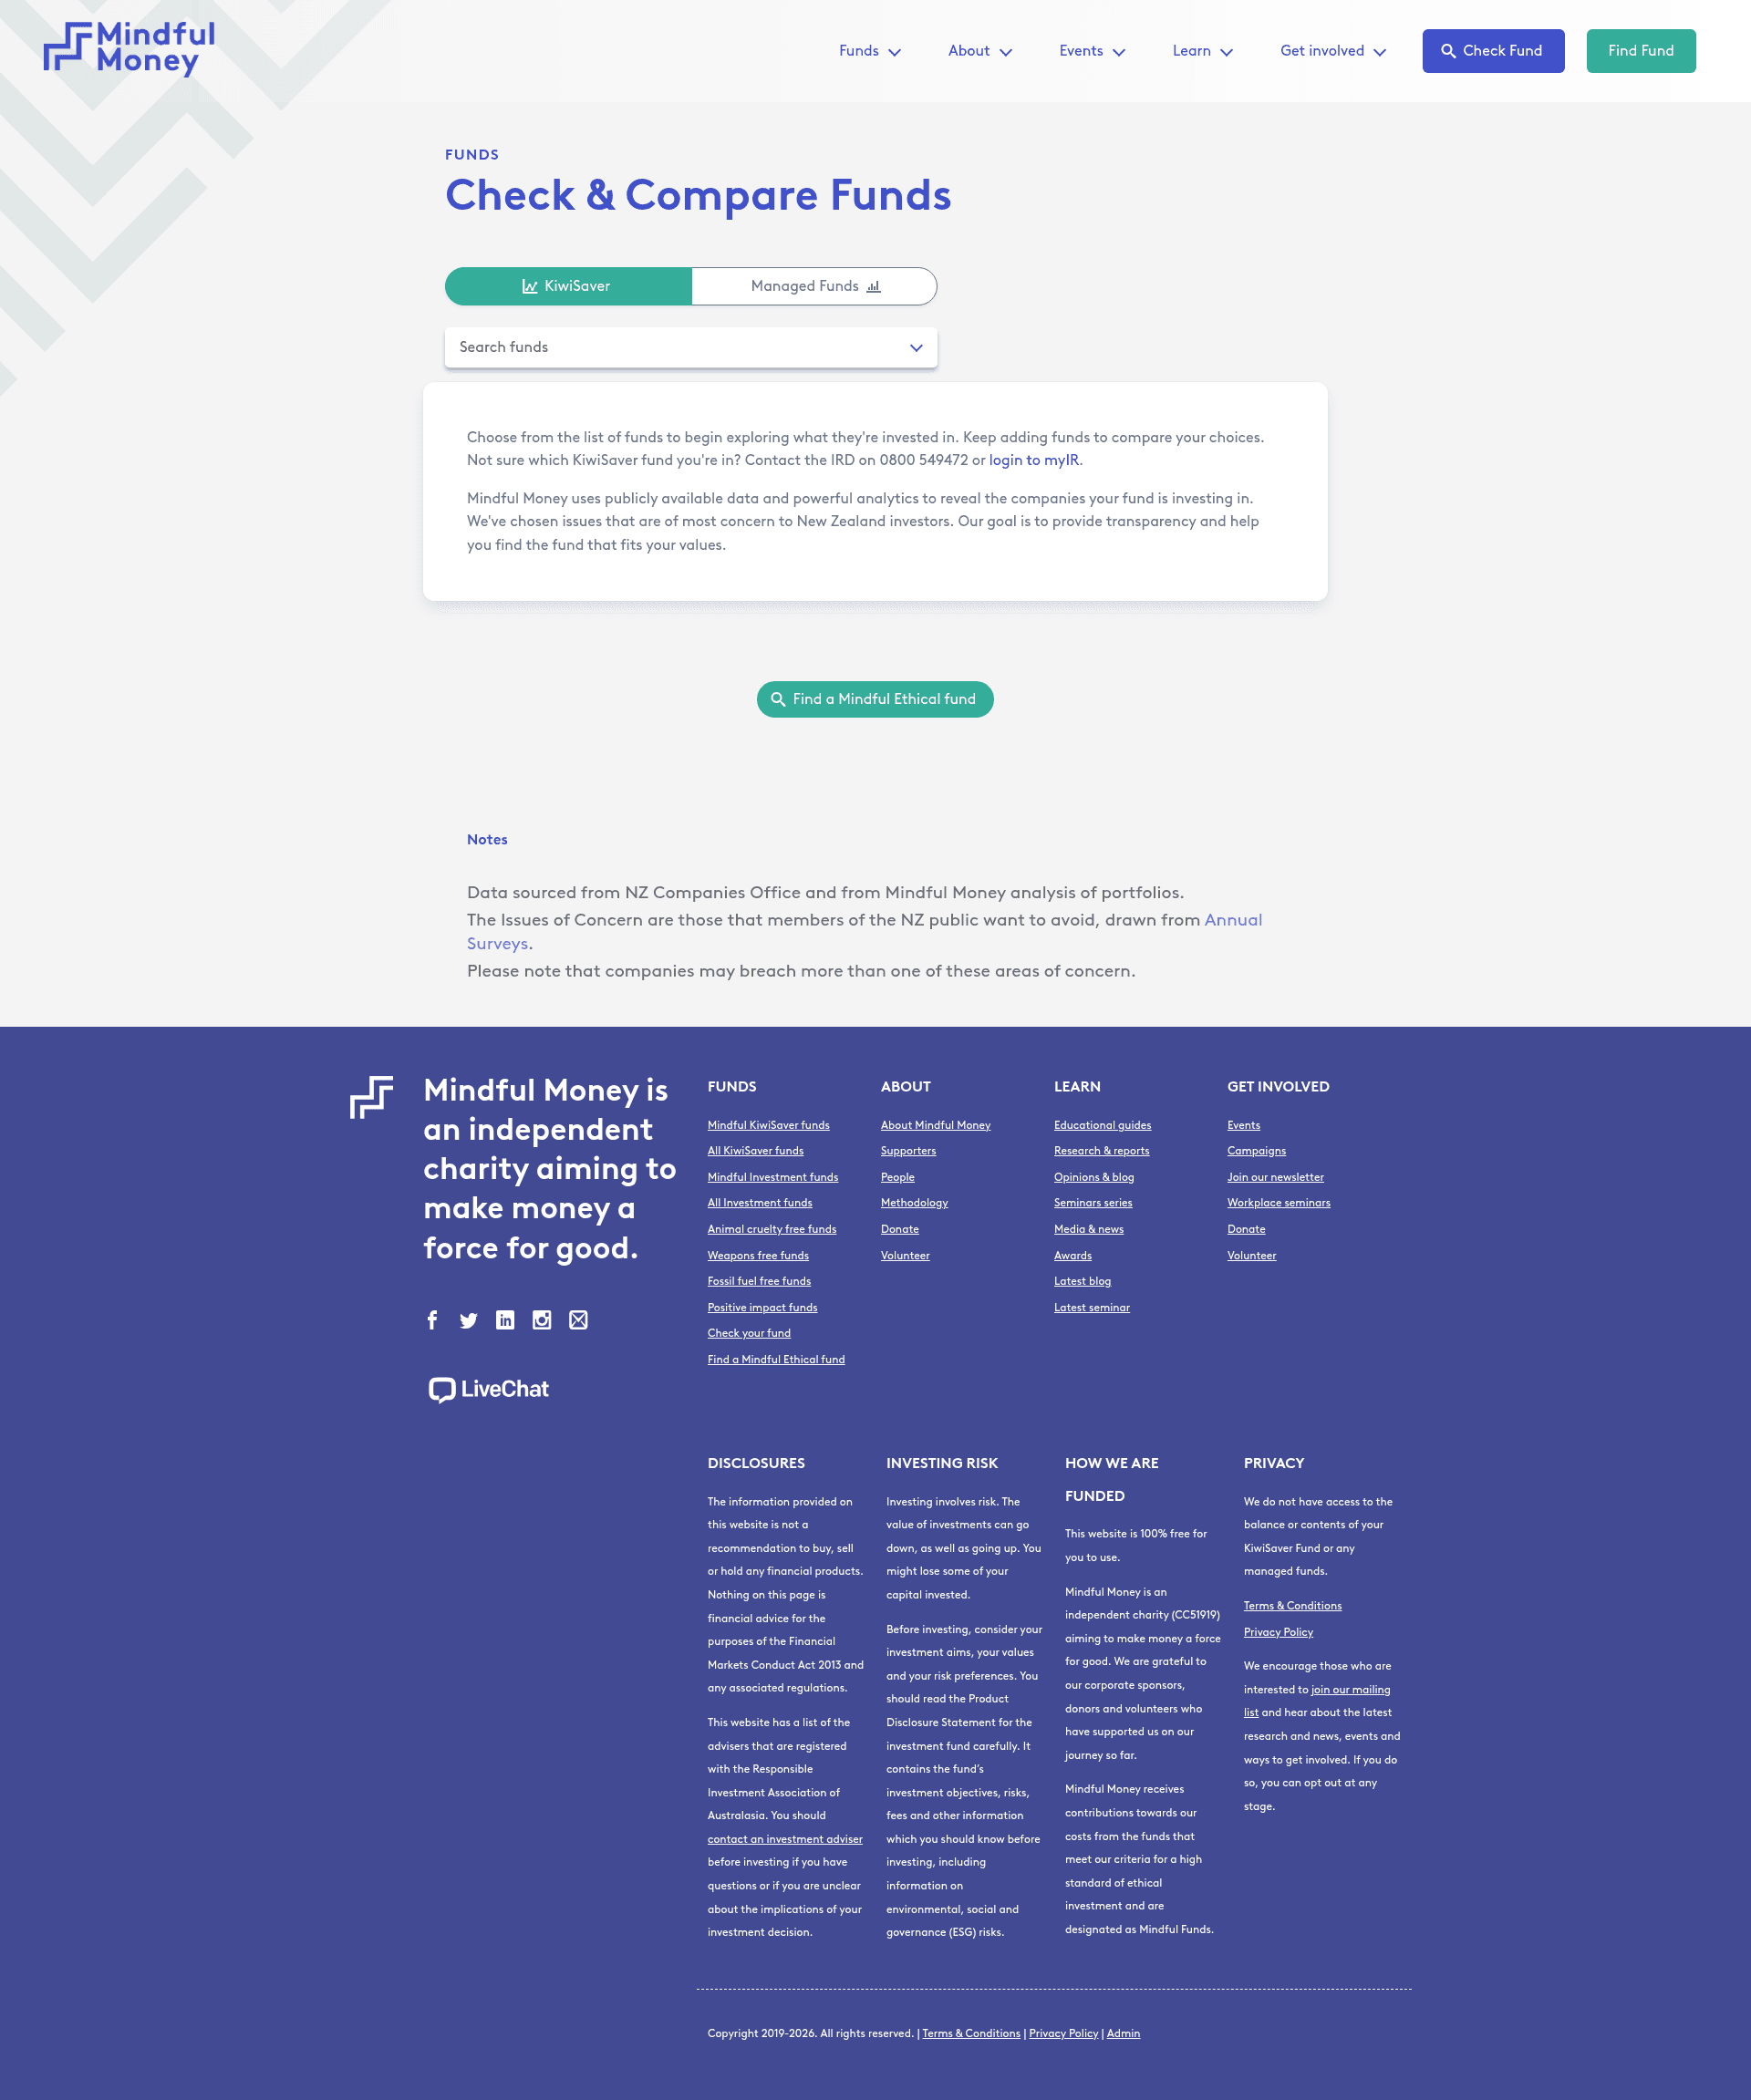
Mindful Money Fund Checker
Free NZ tool to check and compare KiwiSaver funds against ethical issues of concern using publicly available data and portfolio analytics.
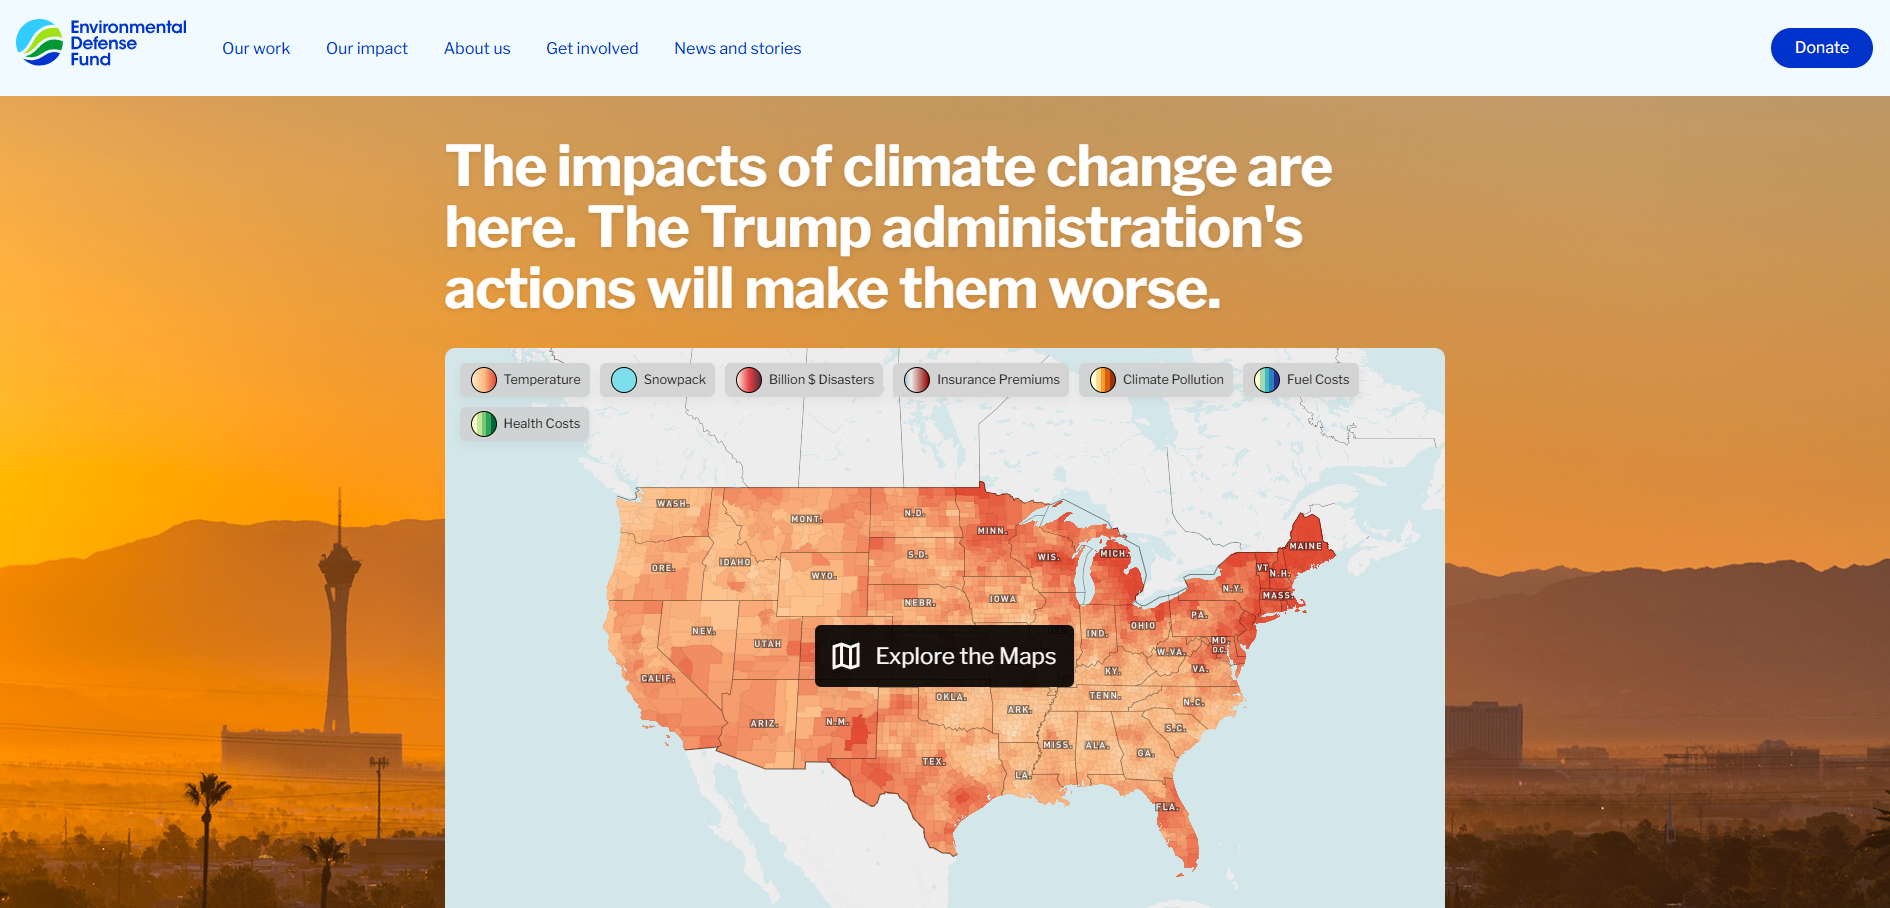
Trump climate endangerment stories
This interactive mapping tool from the Environmental Defense Fund (EDF) combines climate data and community stories to show how climate change is affecting temperatures, water resources, disaster losses, insurance costs and public health across the United States. It also illustrates the projected impacts of changes to federal climate pollution regulations.

Rankings of America's Most Just Companies
The Rankings of America's Most Just Companies evaluate the largest publicly traded US corporations on stakeholder performance and ethical behaviour.
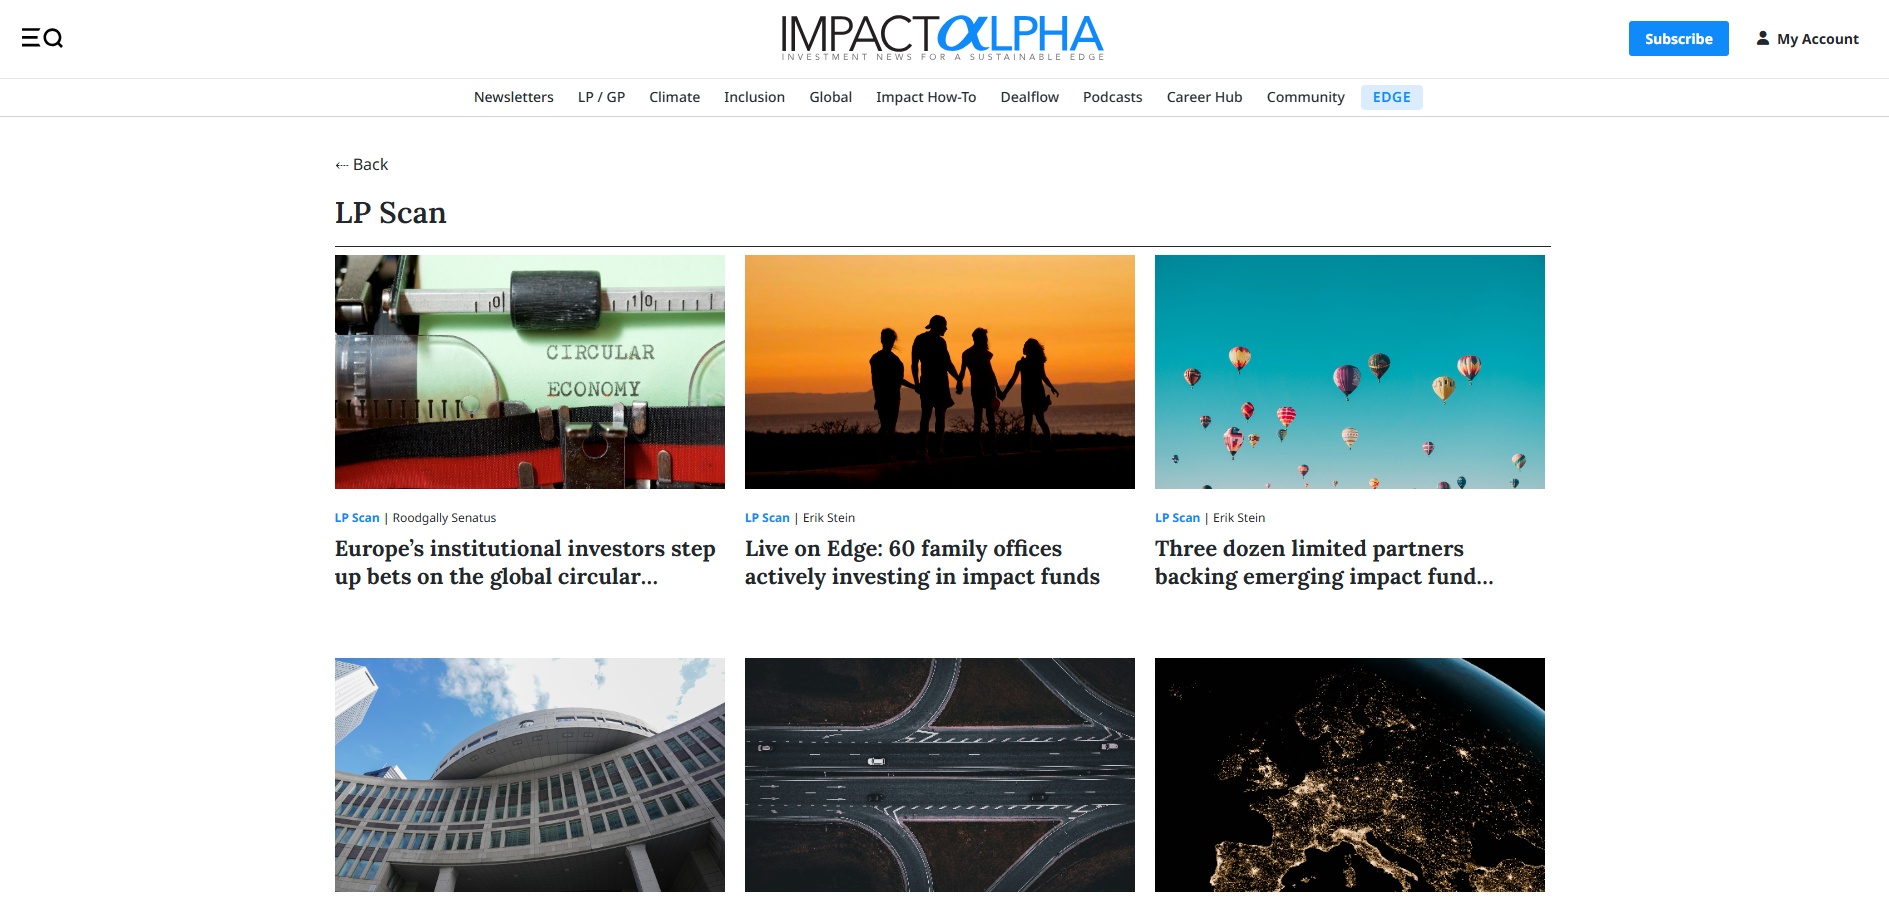
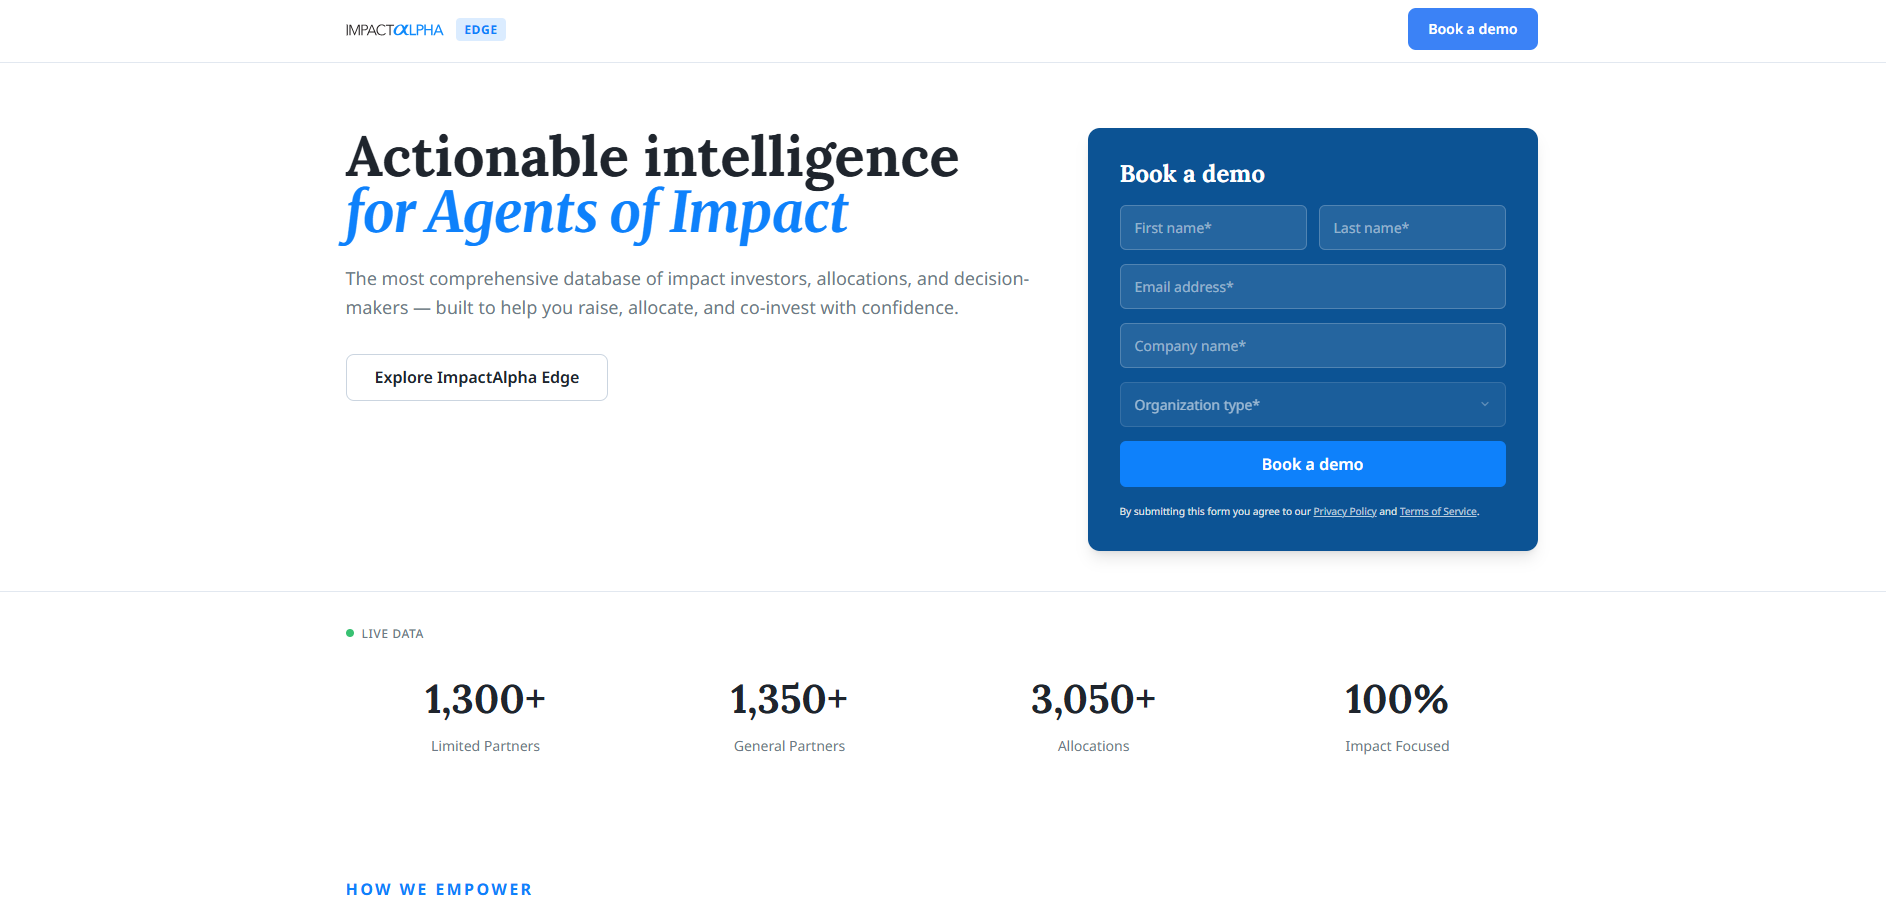
LP Scan
ImpactAlpha’s LP Scan is a dealflow and market intelligence resource that tracks limited partner (LP) activity, fund allocations and investment trends across impact investing. It provides insights into institutional investors, capital flows and fundraising activity to help market participants identify opportunities and understand developments in sustainable and impact finance.
Climate Shift Index: Humid Heat
Climate Shift Index: Humid Heat tracks and calculates the influence of human-caused climate change on daily humid heat conditions across the globe.
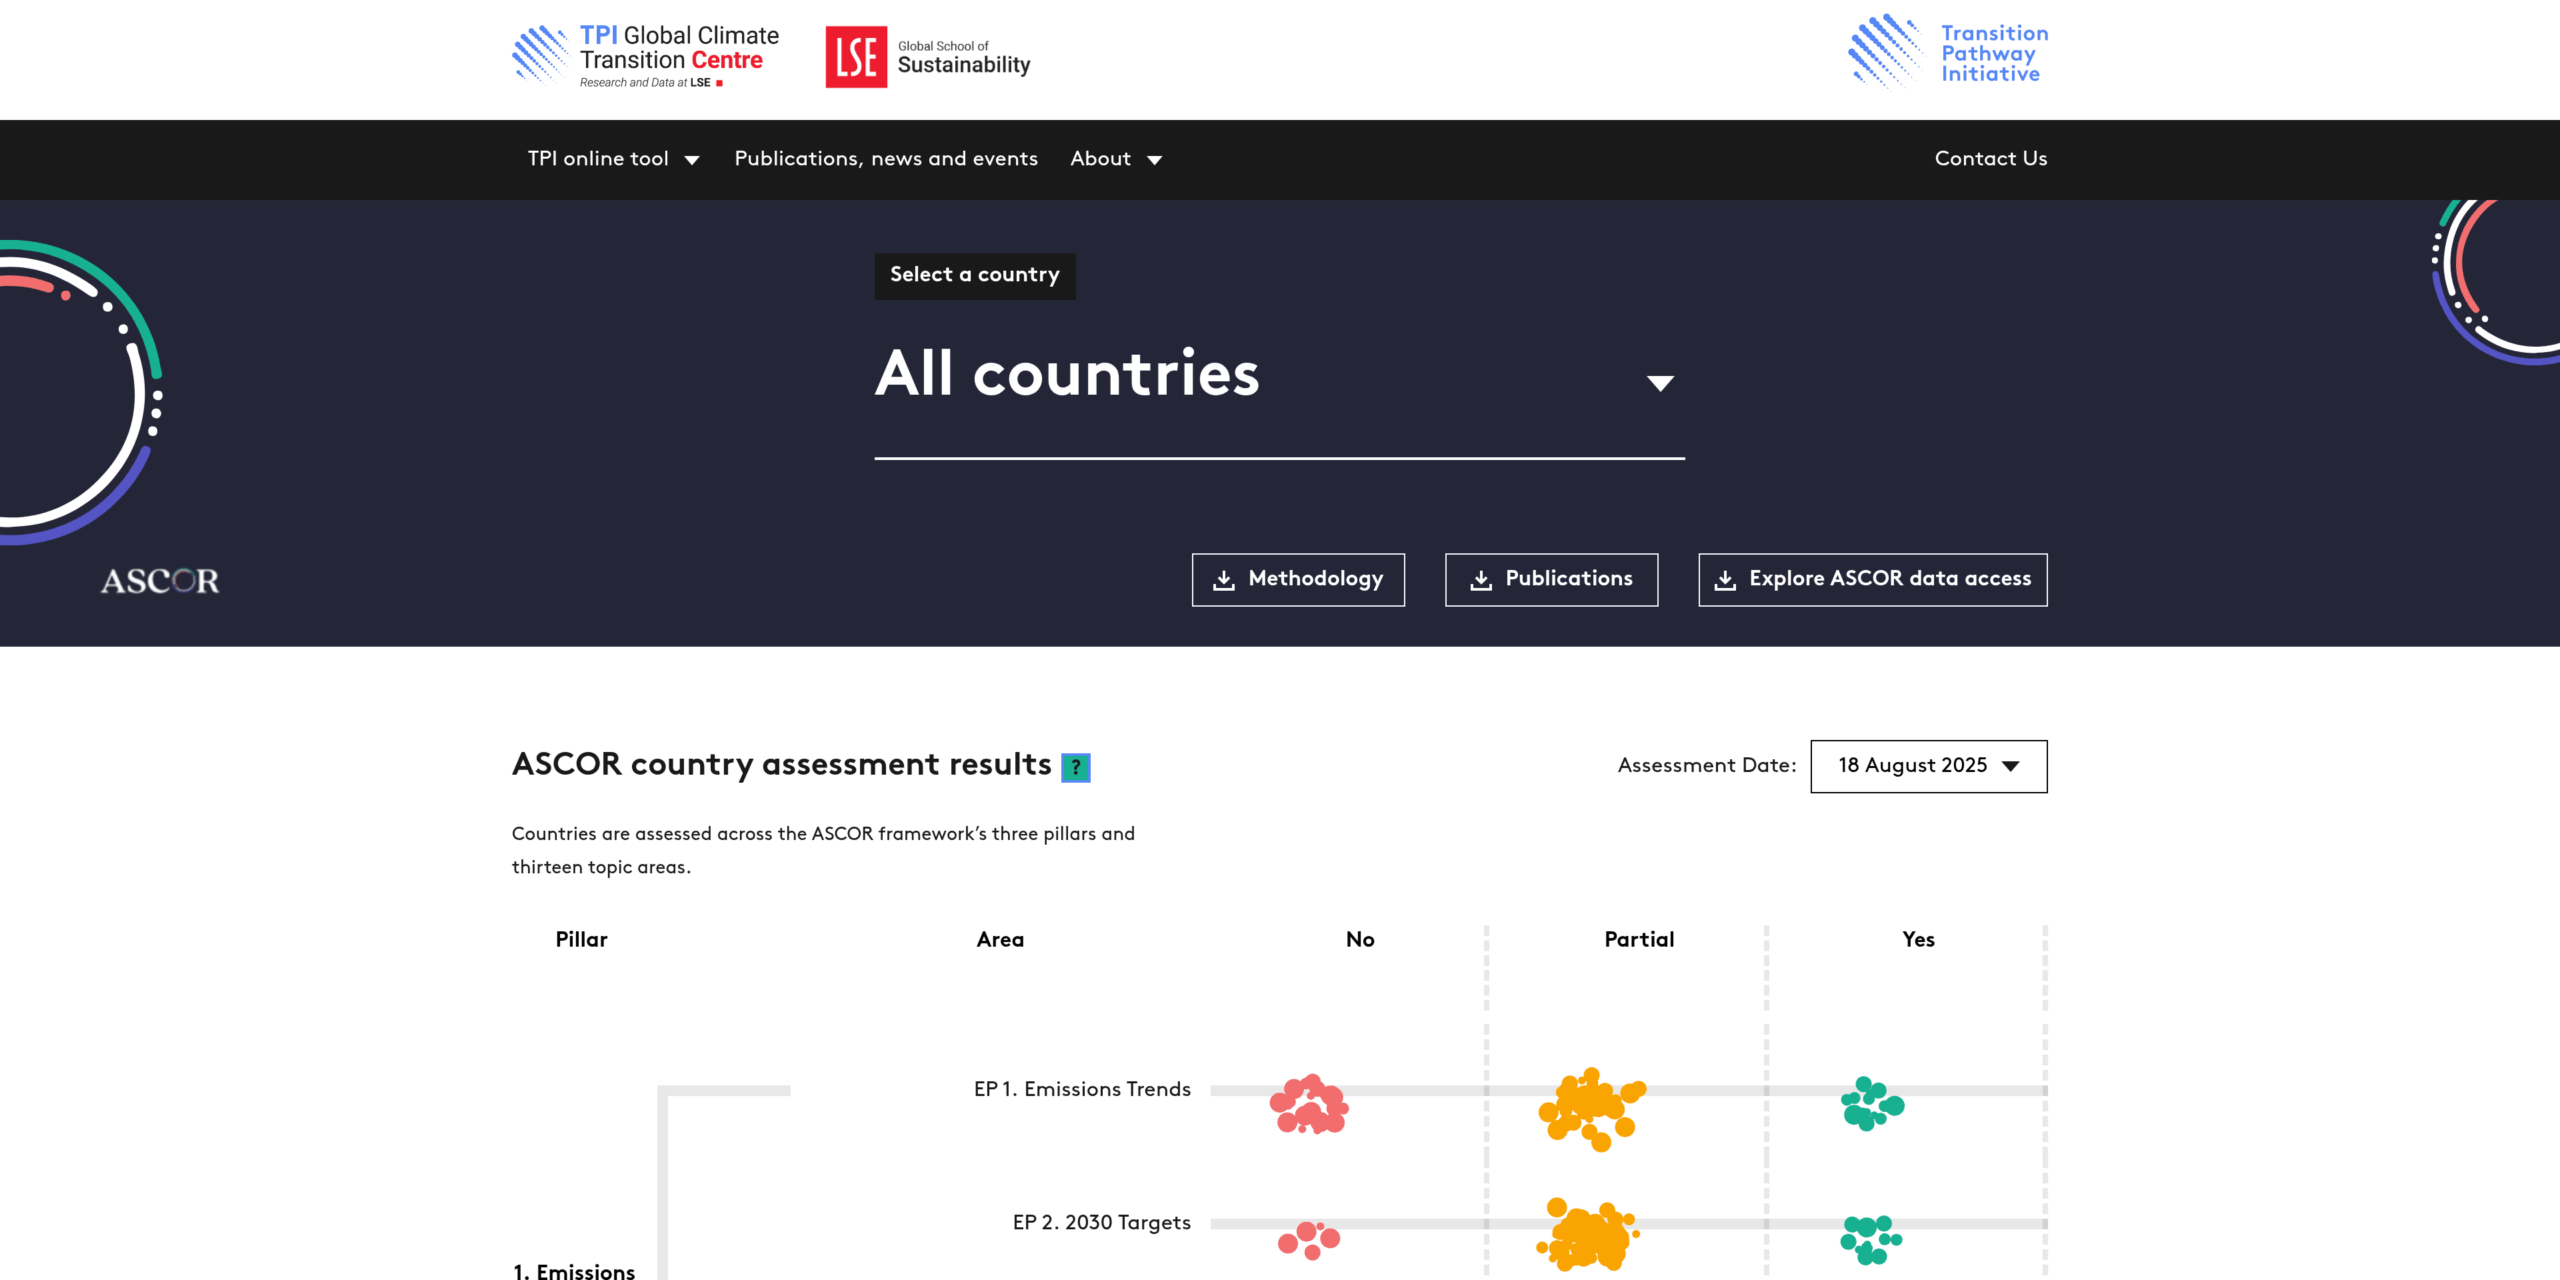
ASCOR Tool
The ASCOR Tool is an investor-led framework for assessing how countries manage the low-carbon transition and the impacts of climate change.
Finance for biodiversity data catalogue
The FfB Biodiversity Data Catalogue is an online tool designed to help financial institutions navigate the nature-related data landscape.
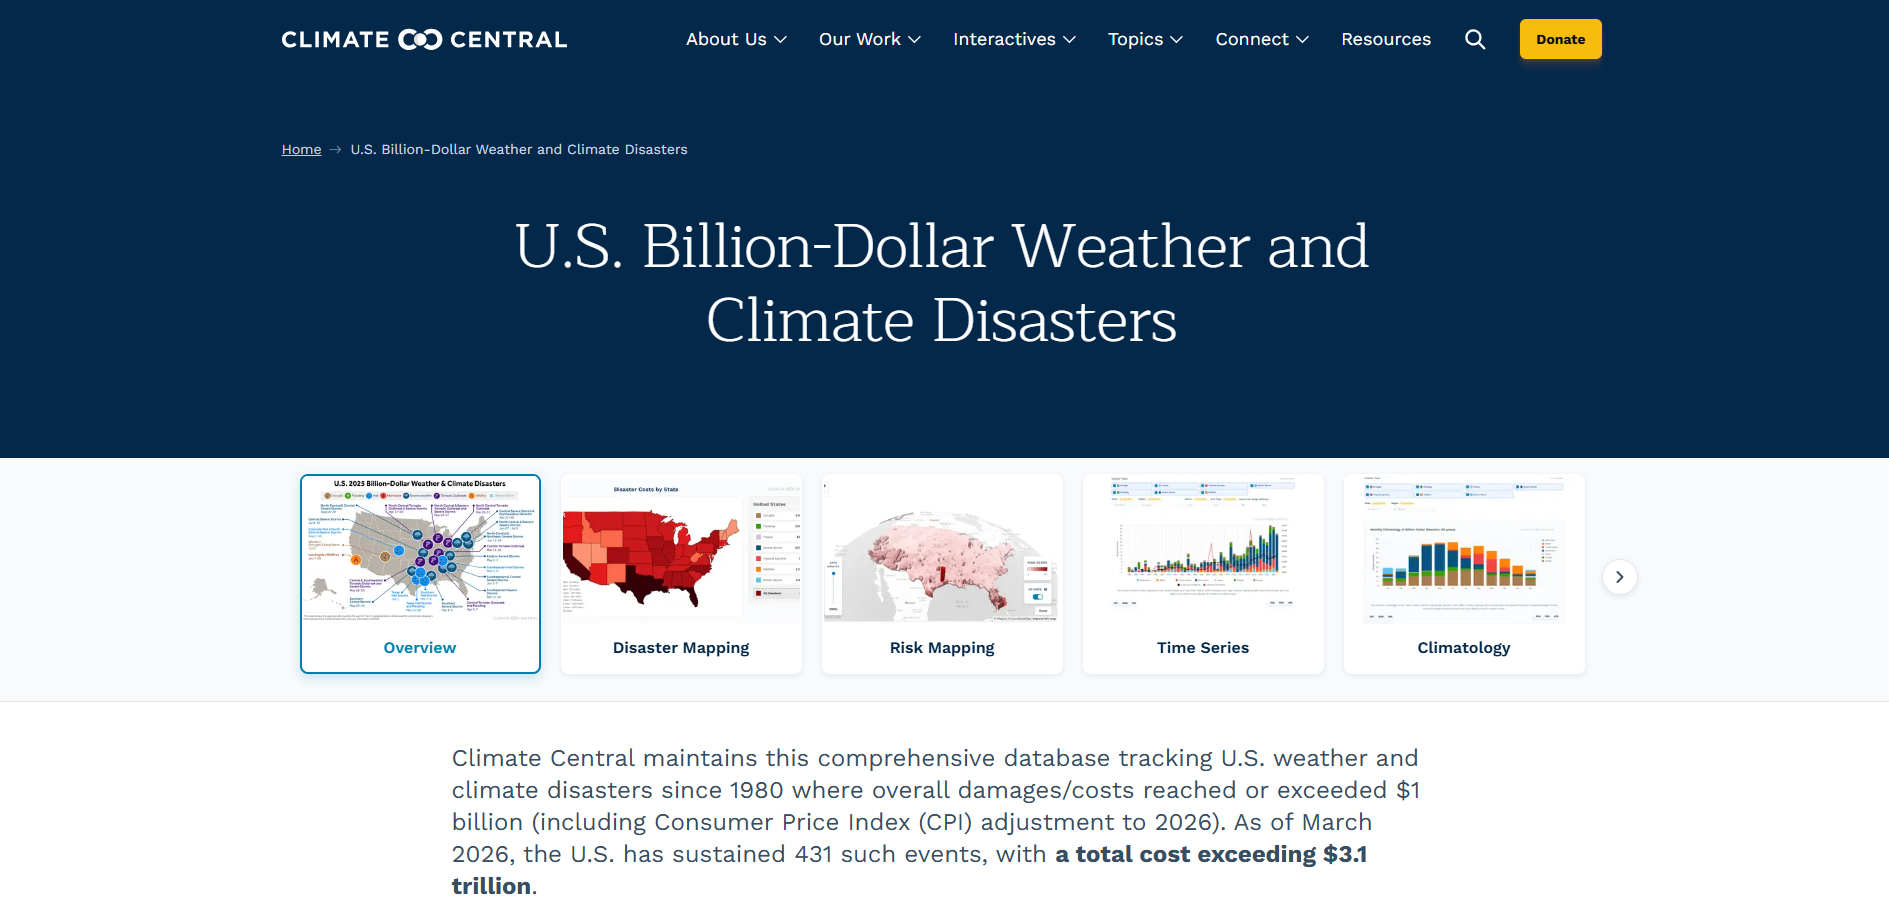
U.S. billion-dollar weather and climate disasters database
Climate Central’s database tracks the most costly U.S. weather and climate disasters since 1980, providing data on events causing $1 billion in damage.
PFAS: From non-stick to stuck in court – Dashboard
The PFAS: From Non-stick to Stuck in Court Dashboard is an online tool developed by Planet Tracker to help investors assess PFAS litigation risk. It maps facility-level exposure across publicly listed companies, supporting ESG analysis, risk assessment and investment decisions related to environmental liabilities.
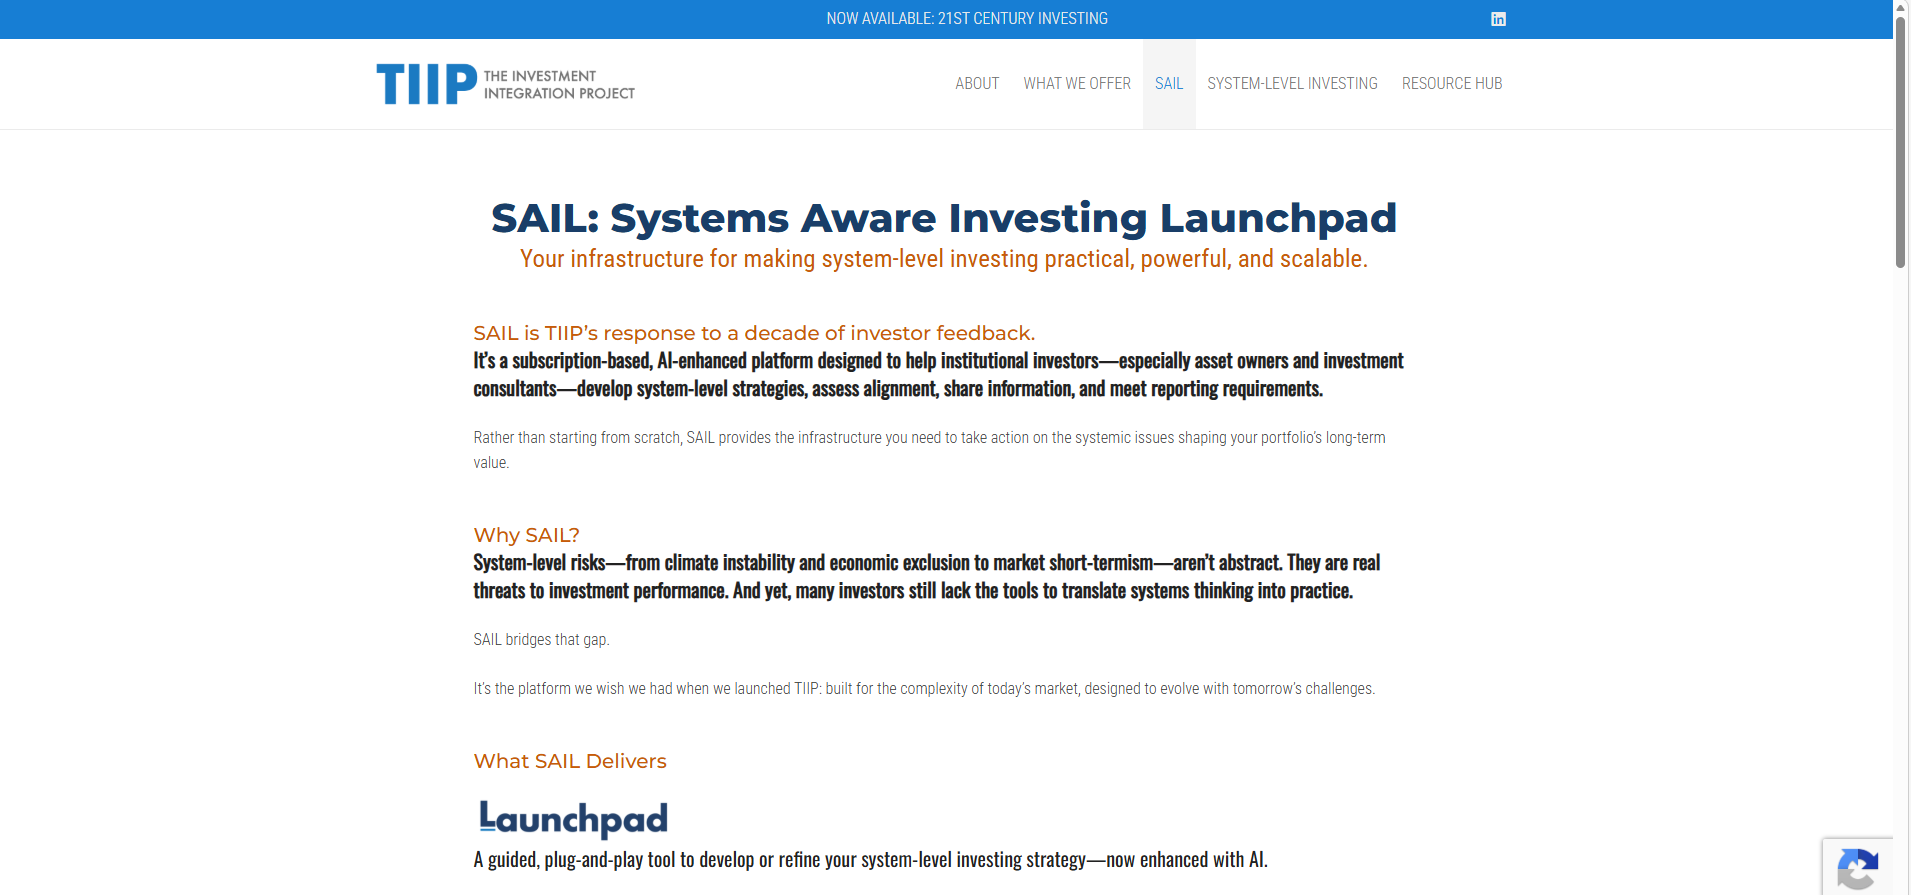
SAIL: Systems Aware Investing Launchpad
SAIL (Systems Aware Investing Launchpad) is an AI-enhanced platform developed by TIIP to support institutional investors in implementing system-level investing strategies. It provides tools for strategy development, benchmarking, reporting and collaboration, helping users assess and manage systemic environmental, social and financial risks.
2026 Living Wage Dataset
The 2026 Living Wage Dataset by Valuing Impact is a free global database covering 217 countries and eight household scenarios. It uses the Anker and Anker methodology with updated cost-of-living data to estimate living wages for urban and rural households, supporting sustainability, labour practice and supply chain analysis.
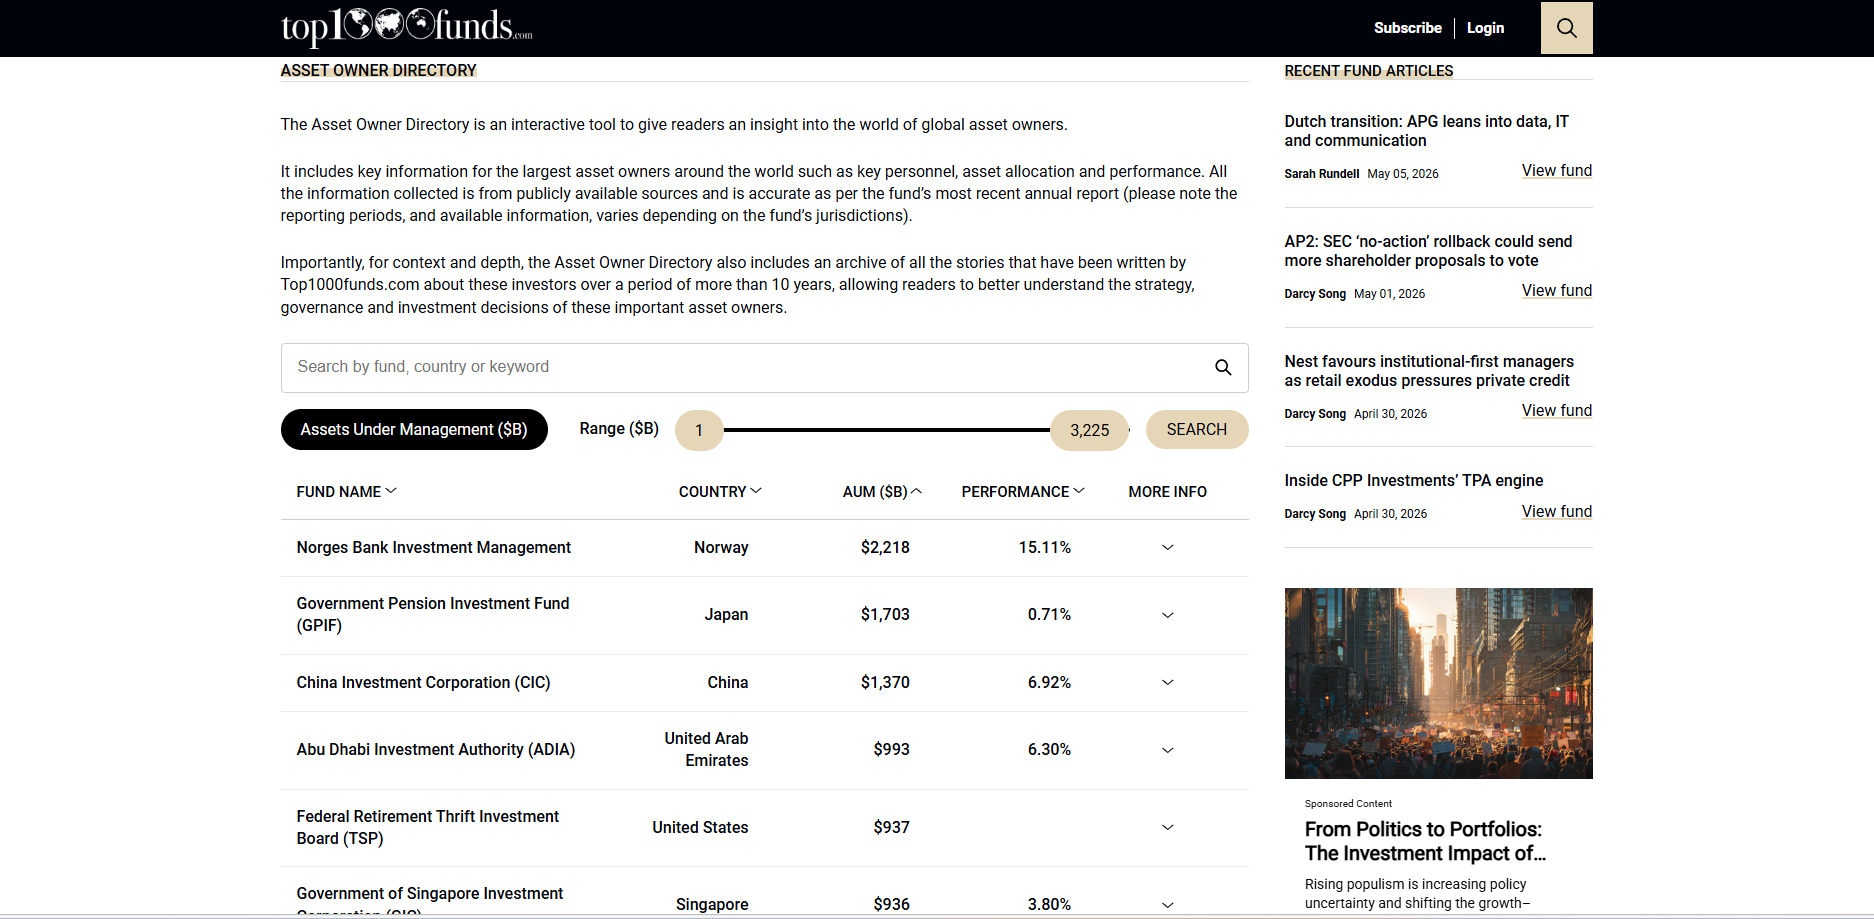
The Asset Owner Directory
Top1000funds Asset Owner Directory is an interactive database covering large global institutional investors, including pension funds and sovereign wealth funds. It provides publicly sourced information on assets under management, asset allocation, performance, governance and key personnel, alongside archived articles and analysis to support research into investment strategy and industry trends.
Mission 300 Progress Portal
Mission 300 Progress Portal is an interactive World Bank tool tracking electrification across Sub-Saharan Africa. It provides data on electricity connections, financing, and project pipelines, supporting analysis of energy access, infrastructure investment, and development finance relevant to ESG and emerging market decision-making.
Navigating the impact valuation landscape: A practitioner’s guide to choosing value factors
A practitioner guide that maps available impact valuation methods and value factor sources, comparing their scope, methodology and use cases. It helps users select appropriate data sources for monetising social and environmental impacts, addressing fragmentation and inconsistencies across existing valuation approaches.
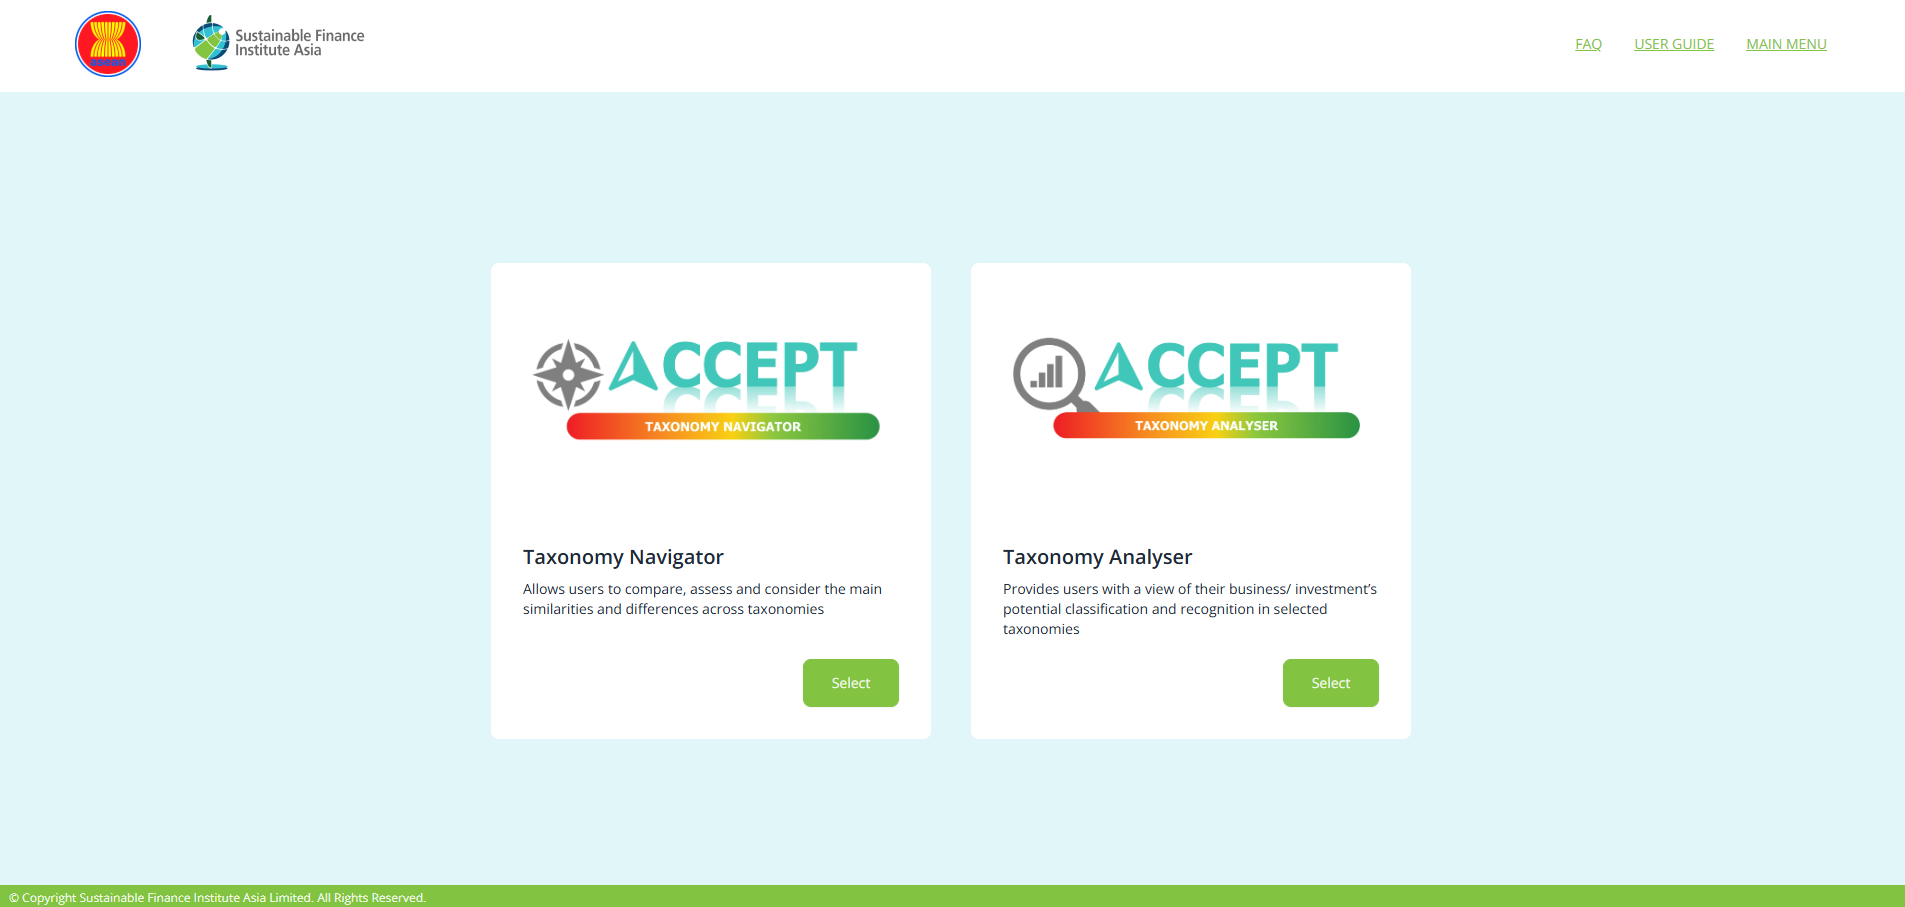
ASEAN Taxonomy Navigator
The ACCEPT Taxonomy Navigator is an online tool that enables users to explore and compare sustainable finance taxonomies, including the ASEAN Taxonomy. It provides a structured view of economic activities and classification criteria, supporting consistent assessment of sustainability alignment and aiding finance professionals in applying taxonomy requirements.