European drought observatory
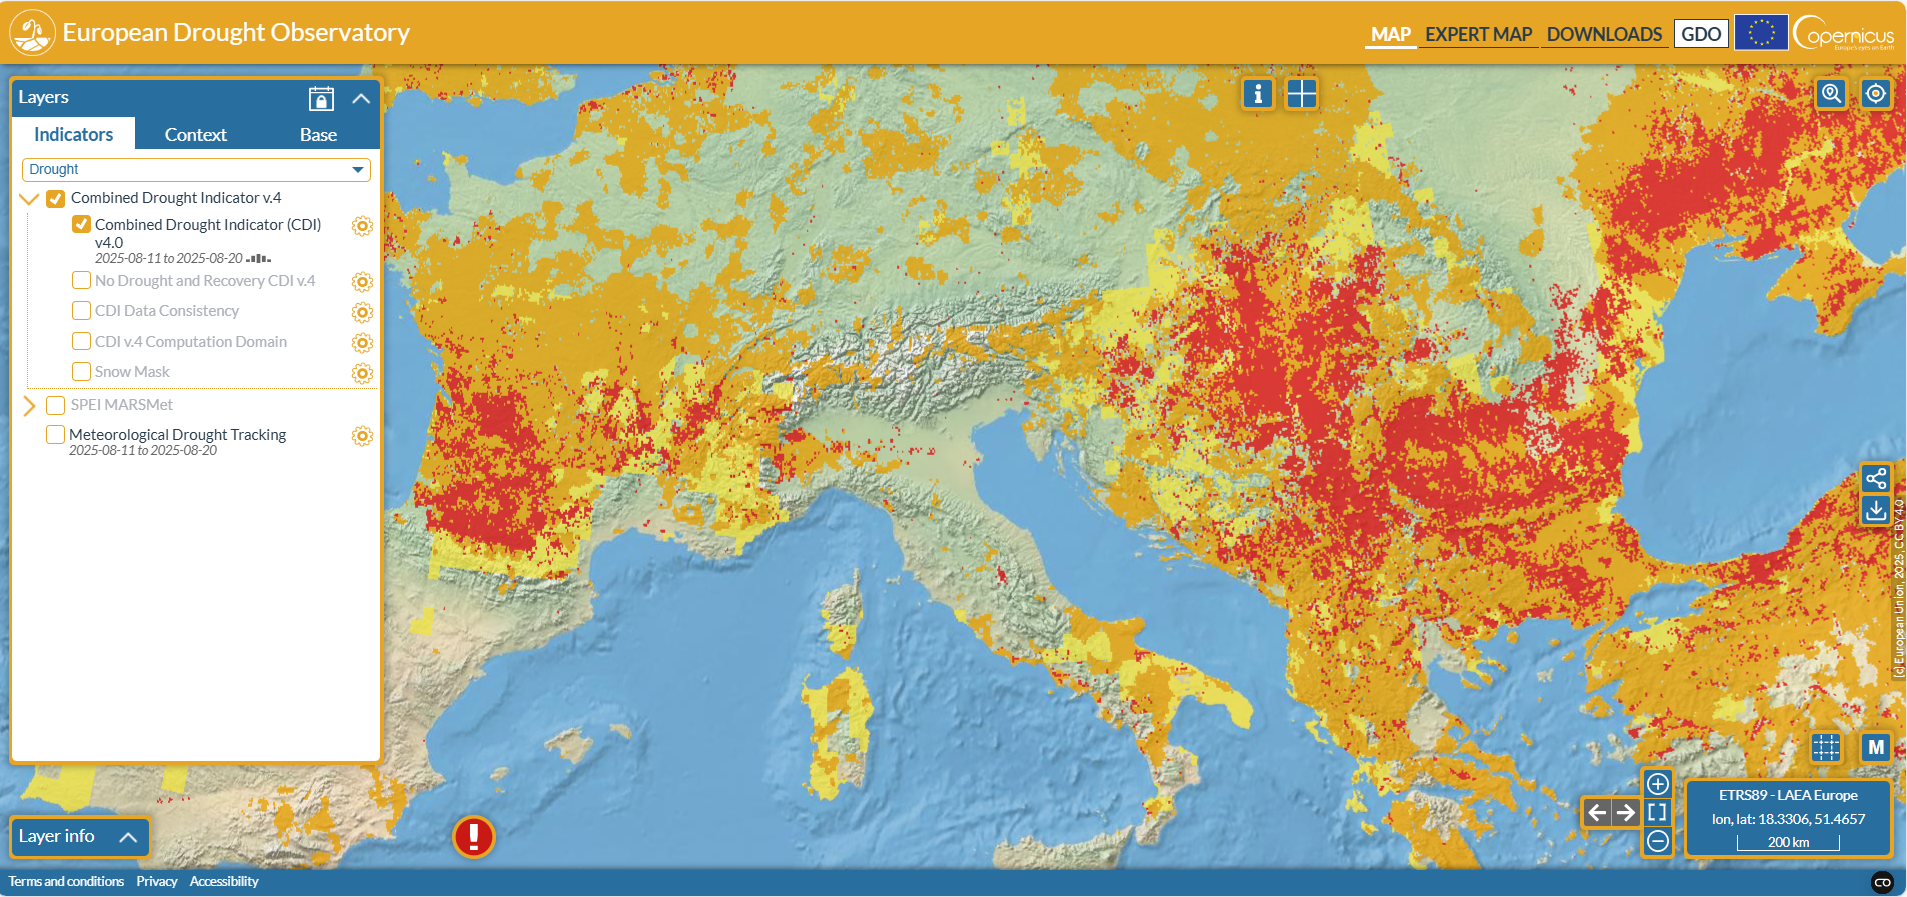
Copernicus’ European Drought Observatory (EDO) mapviewer displays up‑to‑date drought indicators—such as soil moisture, low‑flow, precipitation and the Combined Drought Indicator—across Europe. Users can access, view and download data freely, though caution is advised interpreting some hydrological outputs east of Poland since mid‑May 2025.
Please login or join for free to read more.
OVERVIEW
Organisation
The European Drought Observatory (EDO) is developed by the European Commission’s Joint Research Centre (JRC), as part of the Copernicus Emergency Management Service—an EU satellite Earth-observation and in-situ data programme.
Target audience
Its primary users are public authorities, researchers, policymakers and emergency-management professionals, though the freely available data can also assist environmental analysts and private-sector stakeholders.
Function and utility
EDO delivers near-real-time drought monitoring across Europe via interactive mapping tools. It tracks multiple indicators—including precipitation, soil moisture, vegetation health, low-flow and groundwater—via satellite, models and ground data.
EDO also offers downloadable time-series, graphs and comparison tools for offline analysis. Its Combined Drought Indicator (CDI) integrates precipitation, soil moisture and vegetation anomalies to classify drought severity and recovery stages every ten days.
Relevance to finance professionals
Financial professionals—such as insurers, investment banks and asset managers—can leverage EDO data to assess drought-related risks affecting agriculture, water infrastructure, energy and ecosystem services. It aids in modelling climate-driven exposure, pricing insurance products, evaluating asset vulnerability and informing risk-mitigation strategies.