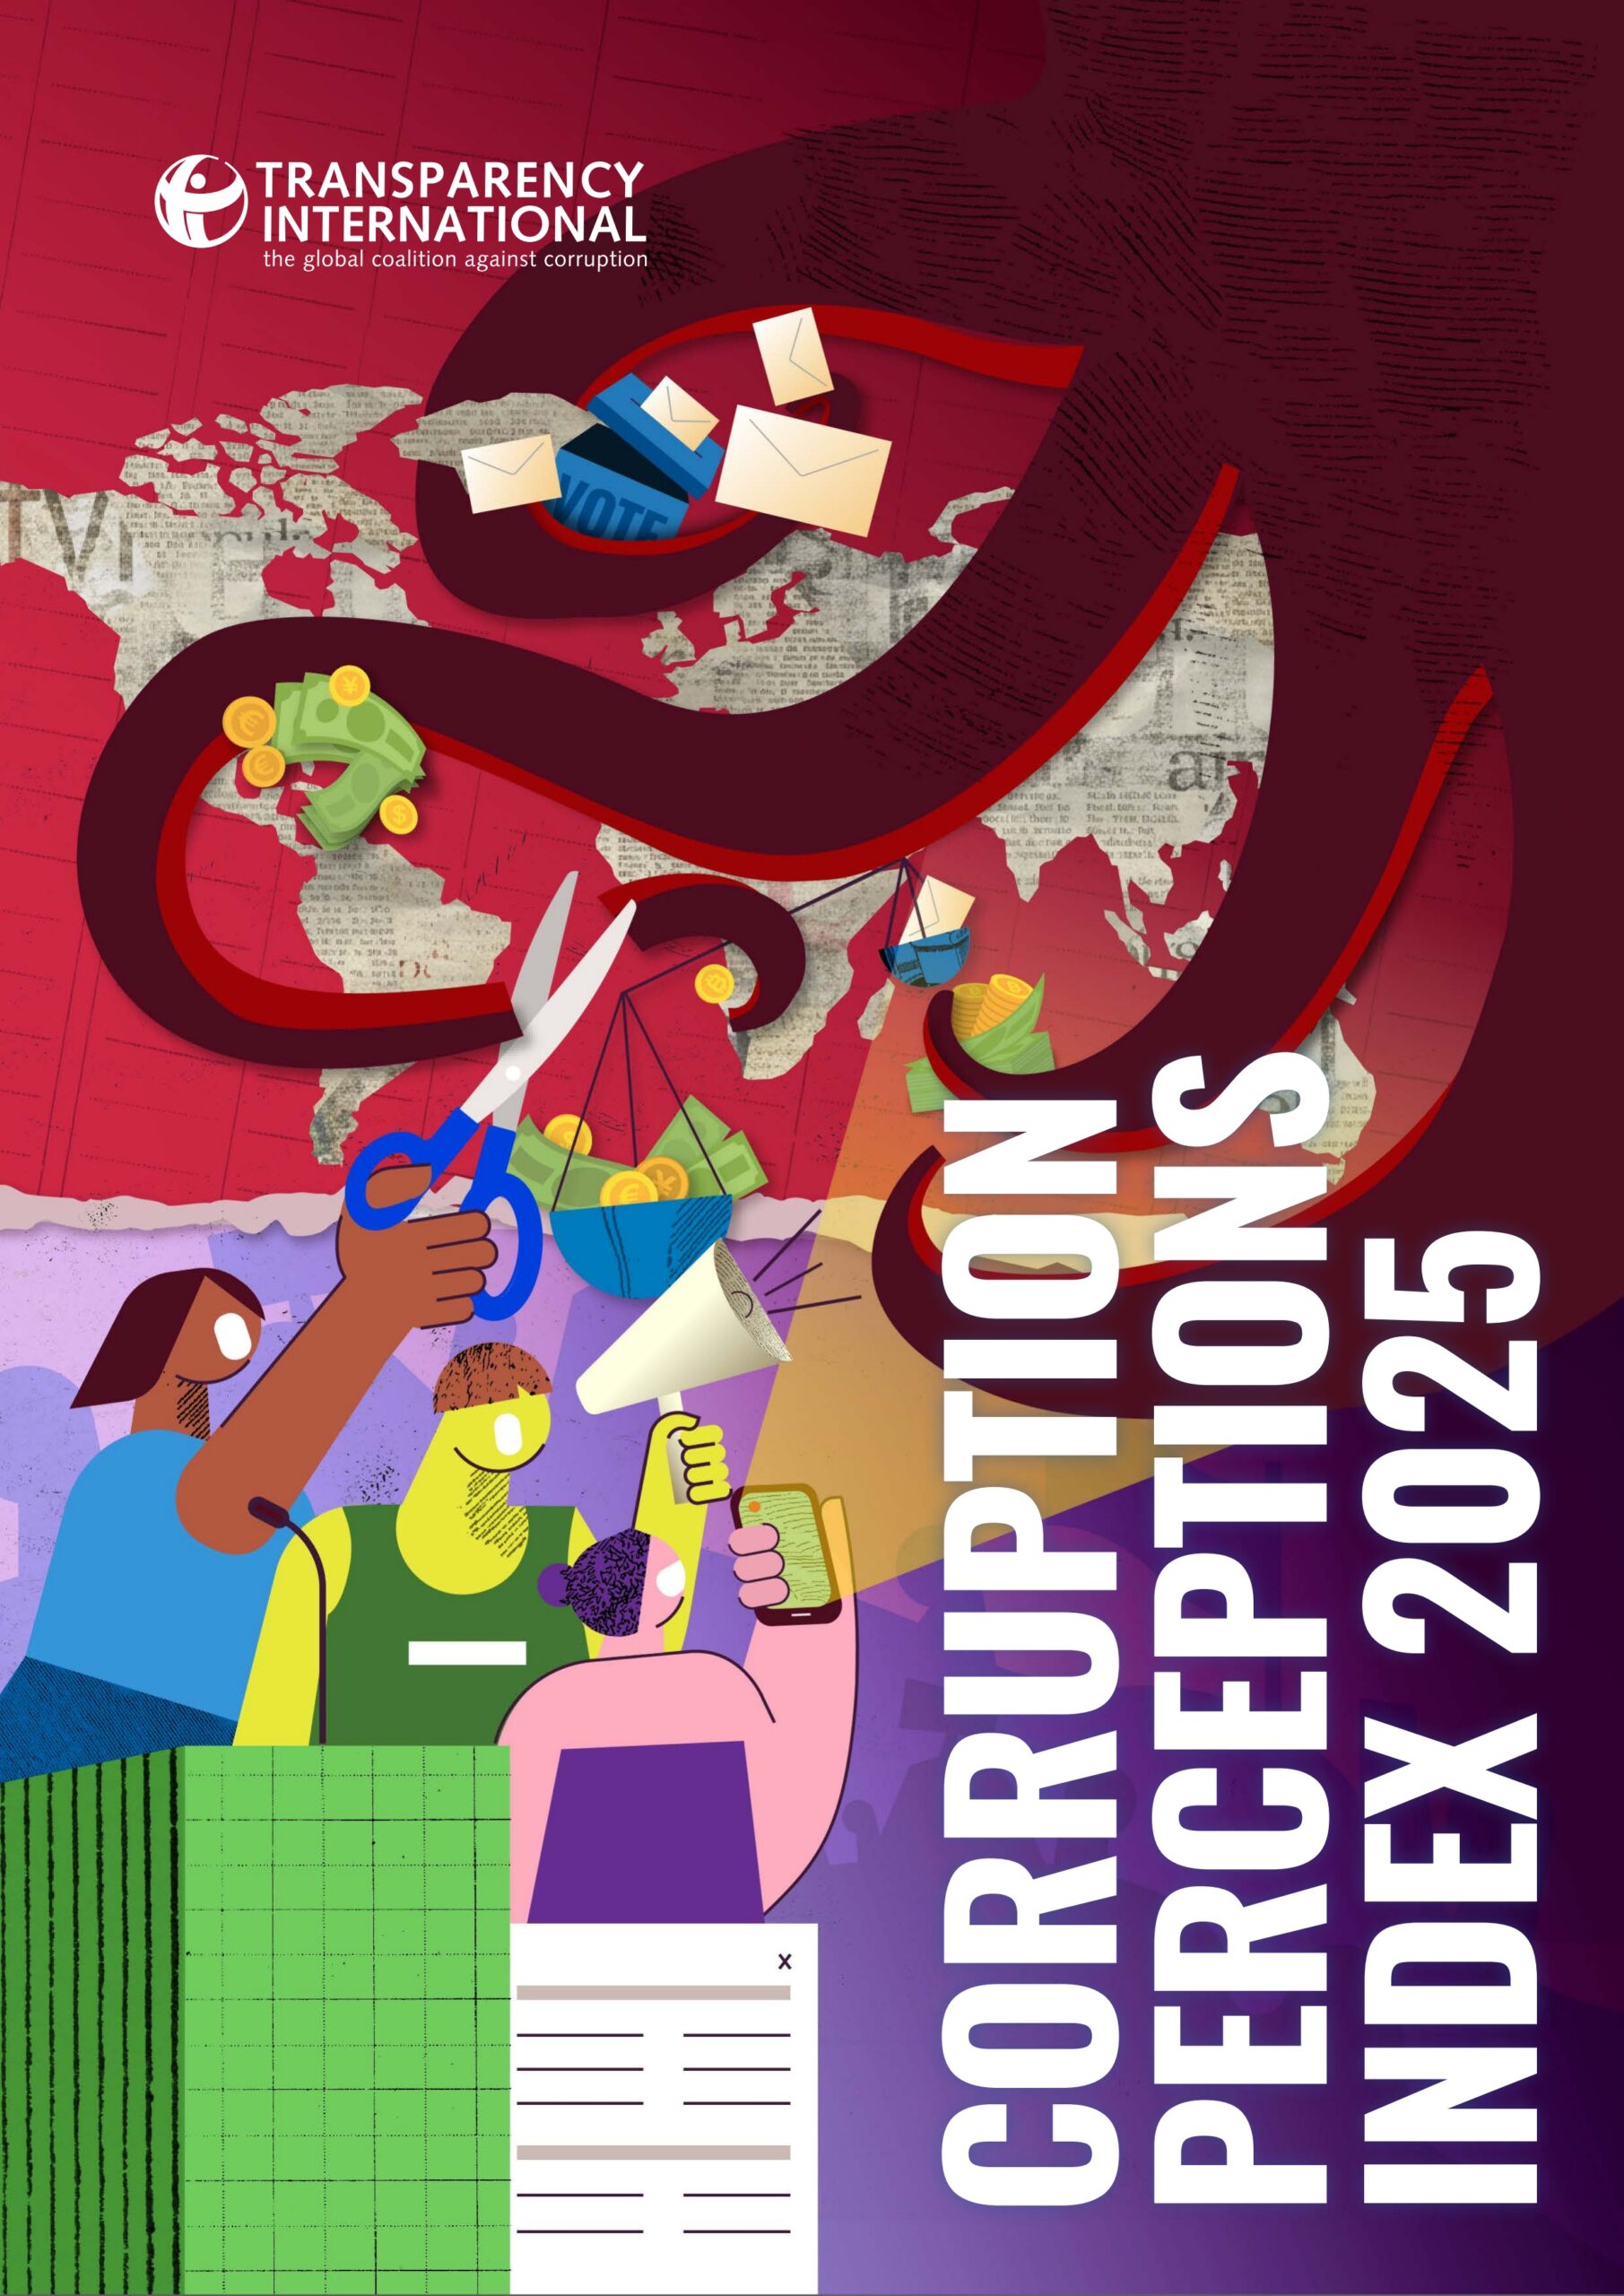
Corruption perceptions index series
The Corruption Perceptions Index is a global benchmark series assessing perceived public sector corruption levels across 182 countries and territories. Produced by Transparency International, the index draws on independent data to provide comparative scores, assisting stakeholders in identifying governance risks and evaluating the effectiveness of anti-corruption reforms and institutional integrity.
Please login or join for free to read more.

OVERVIEW
Overview
The Corruption Perceptions Index (CPI) 2025 is the latest edition of a premier global benchmark series published by Transparency International. This comprehensive report ranks 182 countries and territories based on the perceived levels of public sector corruption. Transparency International, a global movement headquartered in Berlin, works with over 100 chapters worldwide to promote a world free of corruption. The 2025 index reveals a worrying decline in the global average score, which has dropped for the first time in more than a decade to just 42 out of 100. By providing a standardised metric of corruption, the report covers a wide range of geographical regions and government types, offering a high-level view of global integrity trends and the strain on international norms.
Purpose
The primary purpose of this benchmark series is to provide an objective, data-driven assessment of public sector corruption to inform decision-making by governments, international organisations, and the private sector. It exists to highlight the consequences of corruption, such as the erosion of justice systems, the narrowing of civic space, and the degradation of public services. The report is designed to serve as an advocacy tool, encouraging political leaders to implement structural reforms that protect the public interest. Furthermore, it helps to identify systemic failures in both autocracies and democracies, providing the evidence needed for civil society and journalists to hold those in power accountable. By tracking progress or decline over time, the index informs long-term strategies for combatting bribery, money laundering, and state capture.
Methodology
The methodology for the CPI is robust and multi-faceted, relying on 13 independent data sources from 12 different institutions. These sources include surveys of business executives and expert assessments from various international bodies. The index uses a scale ranging from 0 (highly corrupt) to 100 (very clean). Because the underlying data sources use different scales, Transparency International rescales the data using a standardisation process that involves calculating the global mean and standard deviation from a 2012 reference point. This allows for a comparable score that reflects relative perceptions of corruption over time. To be included in the index, a country or territory must be covered by at least three of these data sources. The analysis also incorporates secondary classifications, such as the Economist Intelligence Unit’s Democracy Index and the CIVICUS Monitor, to correlate corruption levels with civic freedoms and government types.
Use for finance professionals
Finance professionals can utilise the Corruption Perceptions Index as a critical component of their risk management and compliance frameworks. It is widely used in anti-money laundering (AML) and ‘know your customer’ (KYC) procedures to identify high-risk jurisdictions. By integrating CPI scores into country risk models, investment analysts can better evaluate the political and regulatory stability of emerging and developed markets. The report also provides valuable data for Environmental, Social, and Governance (ESG) assessments, particularly under the ‘Governance’ pillar, helping professionals to avoid assets or markets where state capture or institutional weakness could lead to asset misappropriation or legal liability. Furthermore, the detailed analysis of cross-border corruption and the role of the private sector in money laundering schemes assists compliance officers in identifying ‘red flags’ related to international capital flows and the use of financial hubs for hiding illicit wealth.
LINKS & ATTACHMENTS
-
Go to source

-
3248 - 2025 - Corruption perceptions index 2025
-
3248 - 2024 - Corruption perceptions index 2024
-
3248 - 2023 - Corruption perceptions index 2023
-
3248 - 2022 - Corruption perceptions index 2022
-
3248 - 2021 - Corruption perceptions index 2021
-
3248 - 2020 - Corruption perceptions index 2020