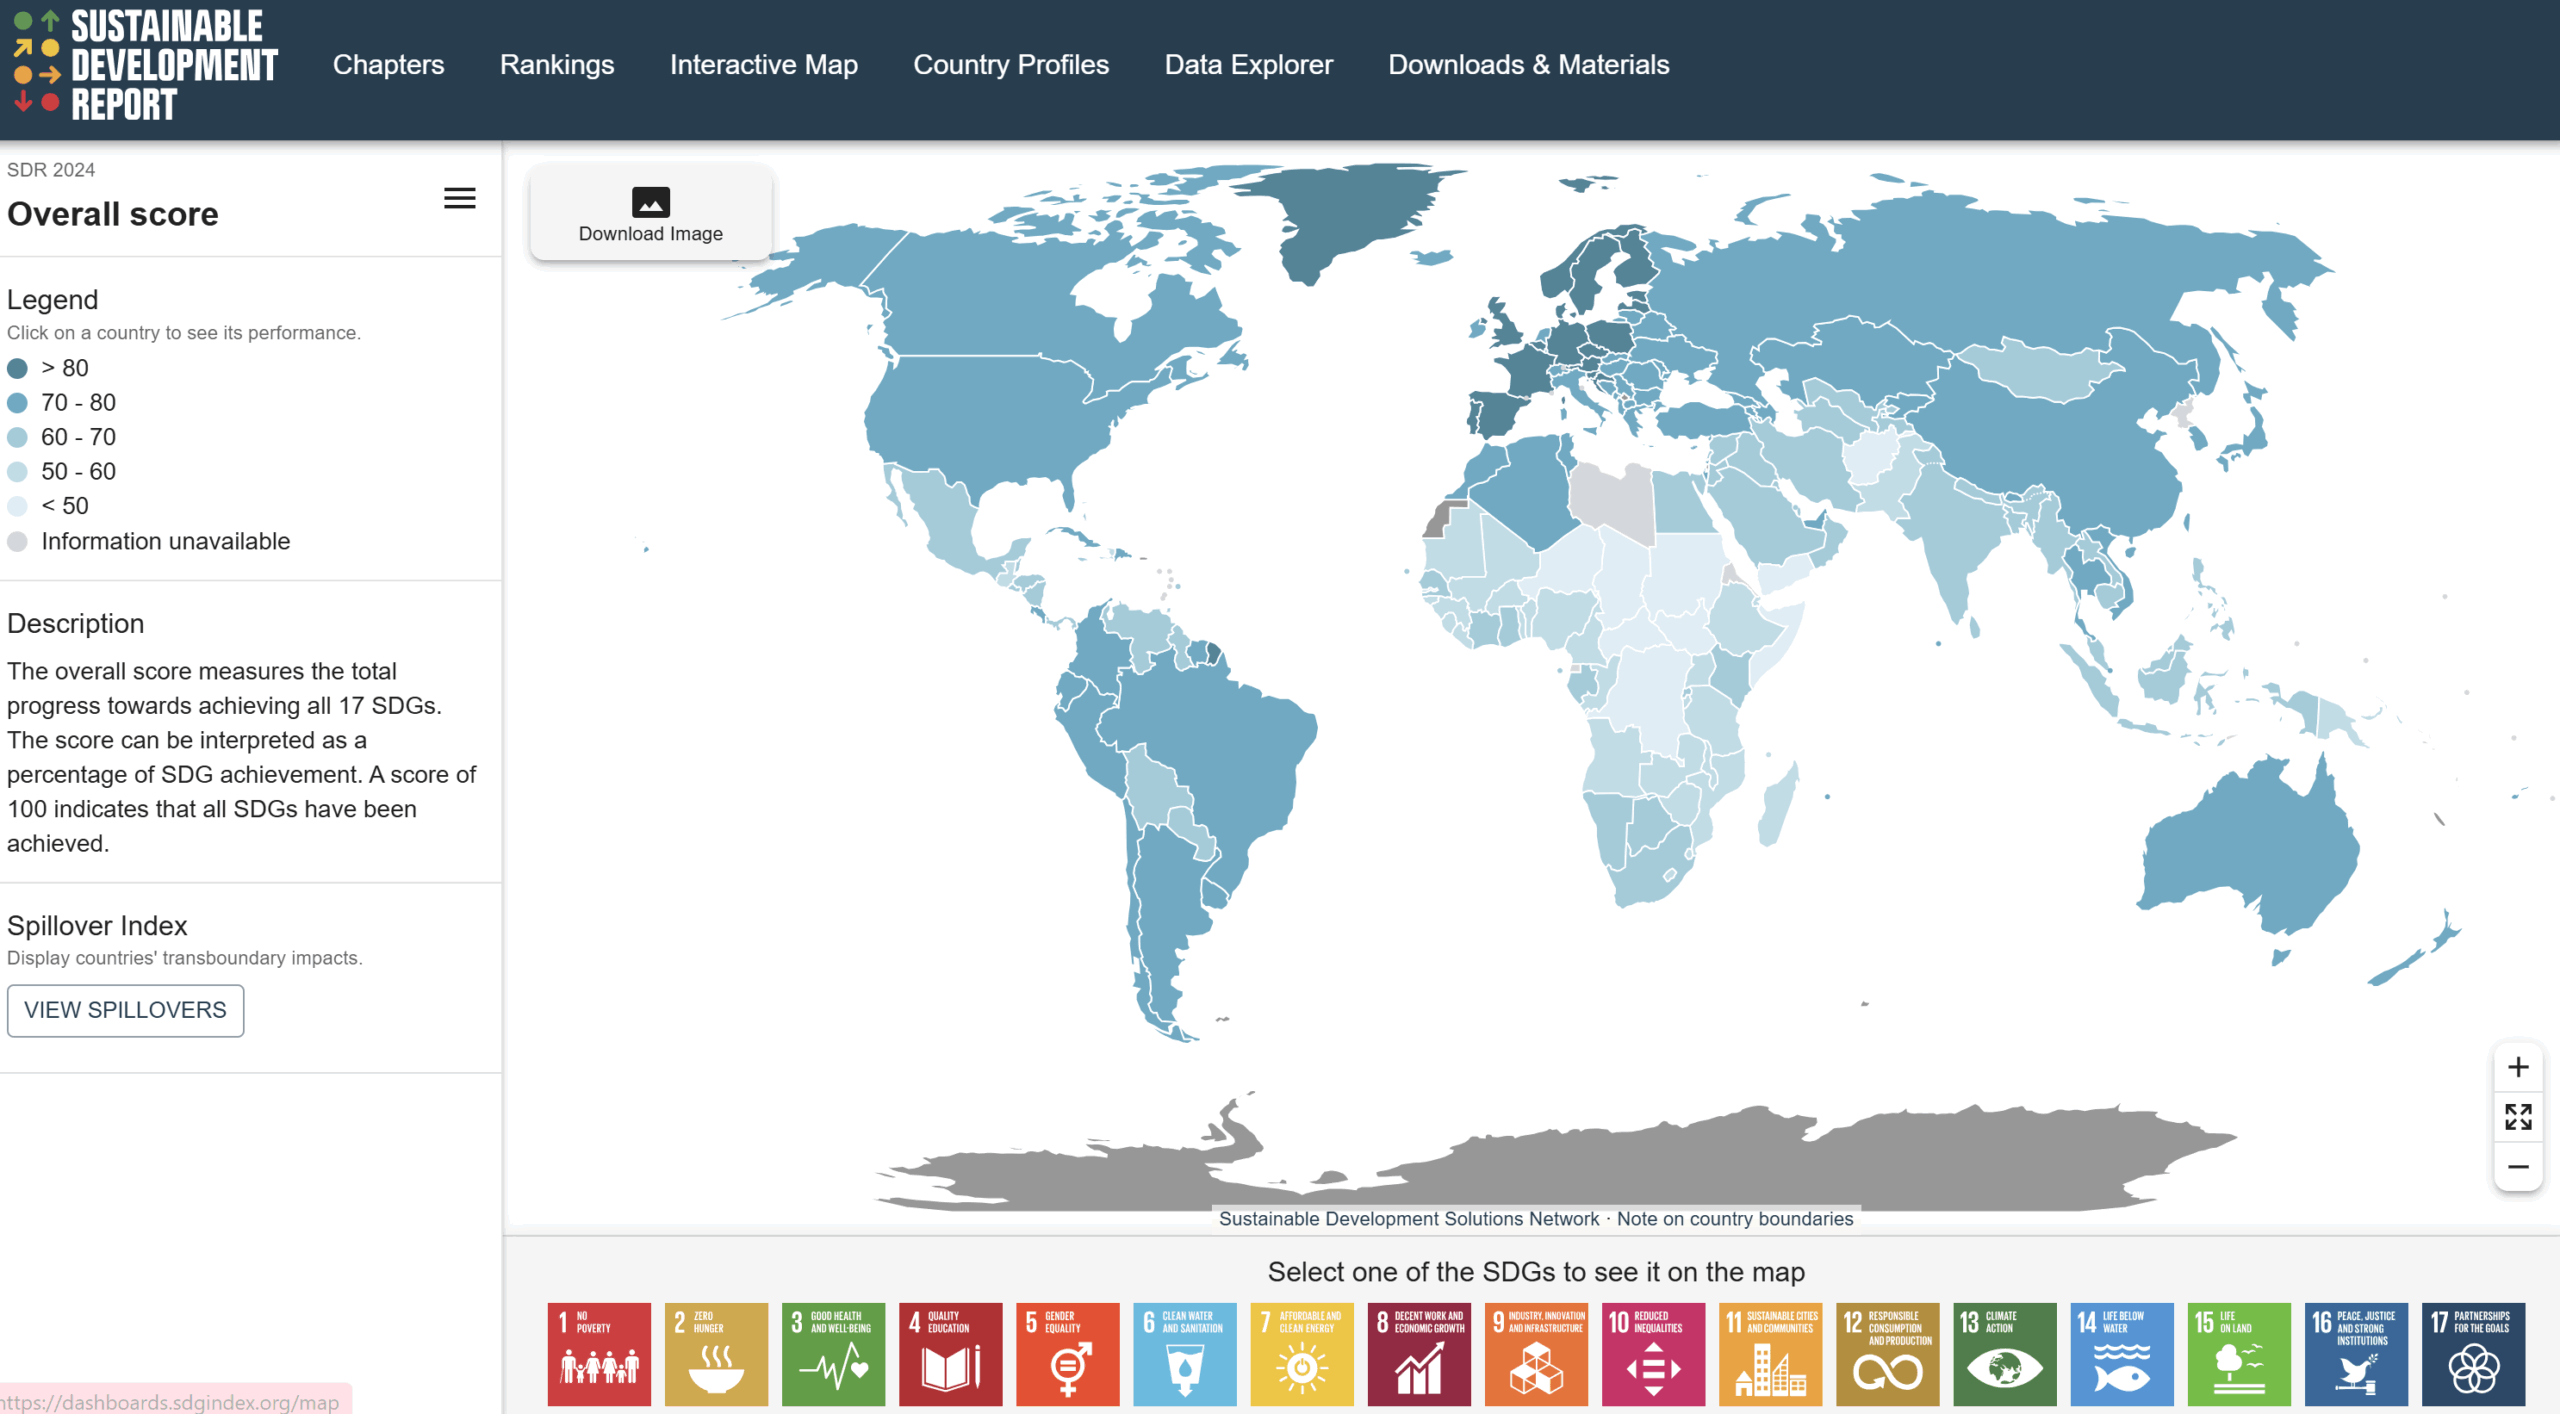
The Sustainable Development Report interactive map is a tool developed by the Sustainable Development Solutions Network (SDSN). It tracks the progress of 193 UN Member States in achieving the 17 Sustainable Development Goals (SDGs). The tool provides an overall score for each country, with 100 representing full achievement of the SDGs.
The primary audience for this tool includes policymakers, researchers, investors, and sustainability professionals. It enables users to assess national performance on sustainability and identify areas requiring improvement. The tool also includes the Spillover Index, which evaluates the global impact of a country’s policies on other nations.
For finance professionals, this tool is relevant in several ways:
Investment analysis – The data can inform ESG (Environmental, Social, and Governance) investment decisions by identifying countries committed to sustainable development.
Risk assessment – Assessing a country’s SDG performance helps in understanding economic, environmental, and social risks, which are increasingly important in financial decision-making.
Sustainable finance strategies – The tool supports the development of sustainability-linked financial products, such as green bonds and impact investments.
Market insights – By evaluating SDG trends, finance professionals can identify emerging opportunities in sustainable sectors.
The interactive features of the tool allow users to explore country-specific data, compare performances across regions, and track progress over time. This structured approach makes it a useful resource for professionals seeking to integrate sustainability metrics into financial strategies.
Overall, this tool provides finance professionals with reliable sustainability data to support informed decision-making in investment and risk management.