African chemical observatory
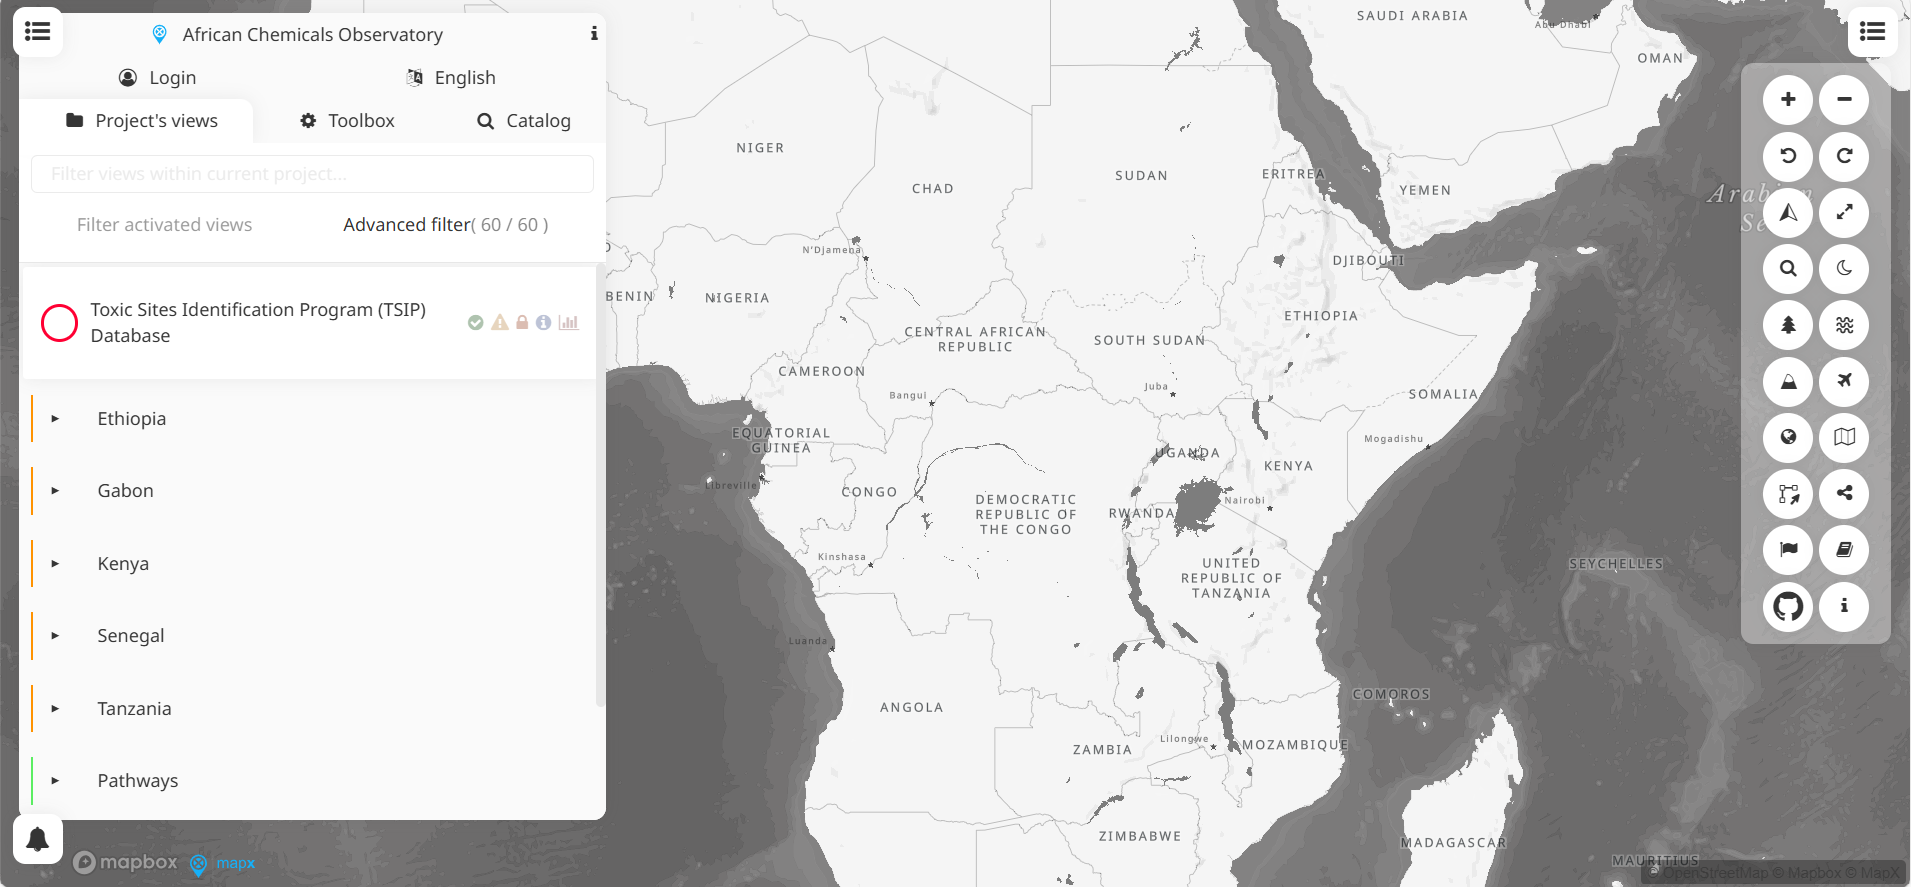
MapX is an open-source, cloud-based geospatial platform for visualising, analysing and managing environmental data. Developed by UNEP/GRID-Geneva, it supports decision-making in biodiversity, climate, land use and disaster risk, through map views, dashboards and storytelling tools.
Please login or join for free to read more.
OVERVIEW
Developer & Organisation
MapX is developed and maintained by GRID-Geneva, via a partnership between the United Nations Environment Programme (UNEP), the Swiss Federal Office for the Environment, and the University of Geneva.
Target Audience
MapX is oriented toward organisations and users dealing with environmental governance: UN bodies, MEA (Multilateral Environmental Agreements) secretariats, NGOs, academia, civil society and local stakeholders.
It also appeals to users working at the interface of environment and development, such as those in extractives, land use, climate, disaster risk and natural resource management.
Functionality & Features
- Geospatial data management & visualisation: handles vector, raster and tabular data, supports maps, overlays, time-series views.
- Dashboards & story maps: enables creation of narrative visualisations and interactive dashboards.
- Data join & analytics tools: supports SQL-style joins, intersection tools, combination of spatial and tabular datasets.
- Access control & roles: projects support multiple user roles (public, member, publisher, administrator).
- Interoperability & API/SDK support: designed on open-source libraries, interoperable with external services, embedding via SDKs.
- Optimisation & scalability: cloud-based, designed for low bandwidths, scalable with Kubernetes.
Relevance to Finance Professionals
- Risk & due diligence: overlays environmental and geographical data (e.g. flood zones, land use, biodiversity) with project or asset locations, aiding physical and regulatory risk assessments.
- Sustainability & ESG analysis: supports integration of environmental indicators into financial models, monitoring performance over time or across geographies.
- Project planning & investment prioritisation: spatial visualisations help in siting infrastructure or resource projects, comparing trade-offs across locations.
- Reporting & communication: dashboards and story maps provide accessible visual outputs useful for stakeholder reports, investor communication or impact narratives.